JavaScript/JS D3
D3 is a general-purpose JavaScript library for manipulating documents based on data. D3 helps you bring data to life using HTML, SVG, and CSS.
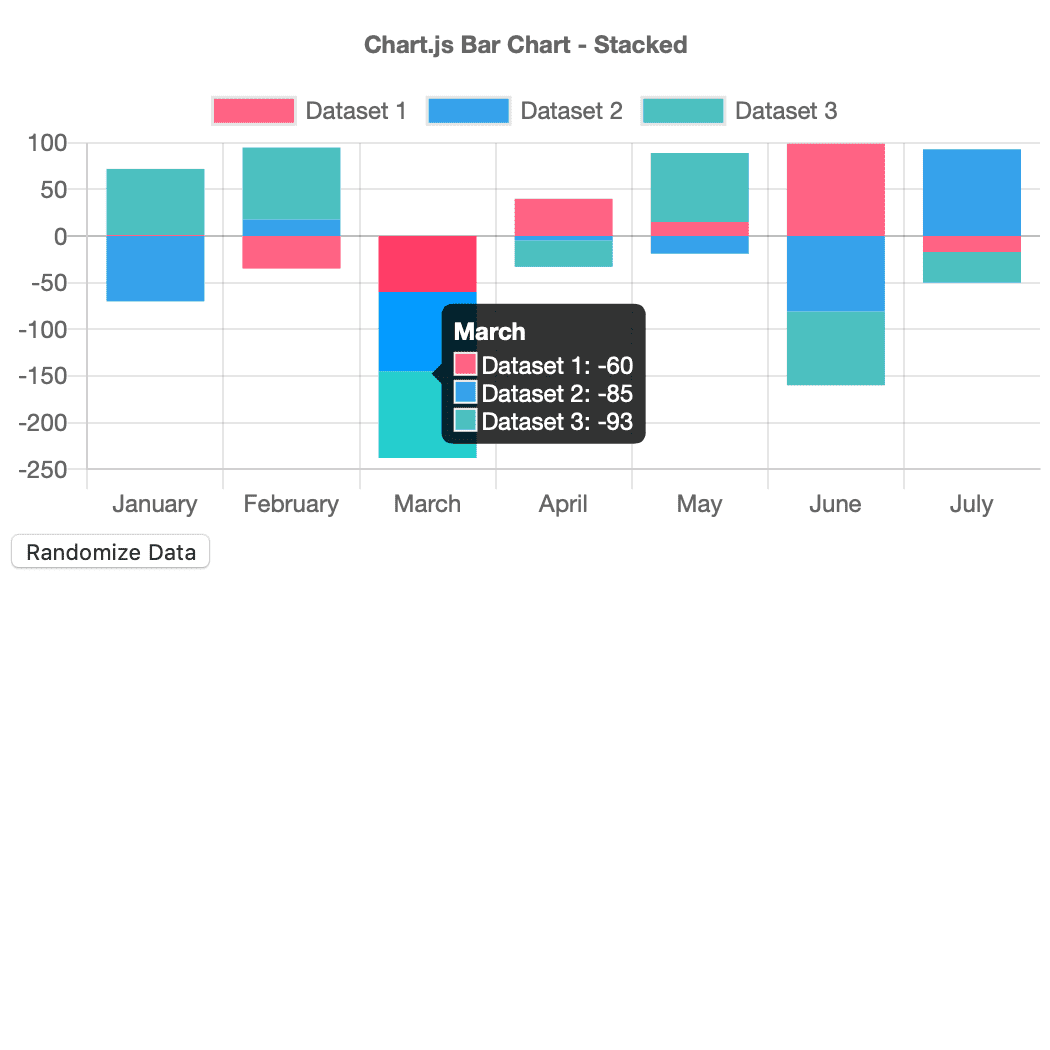
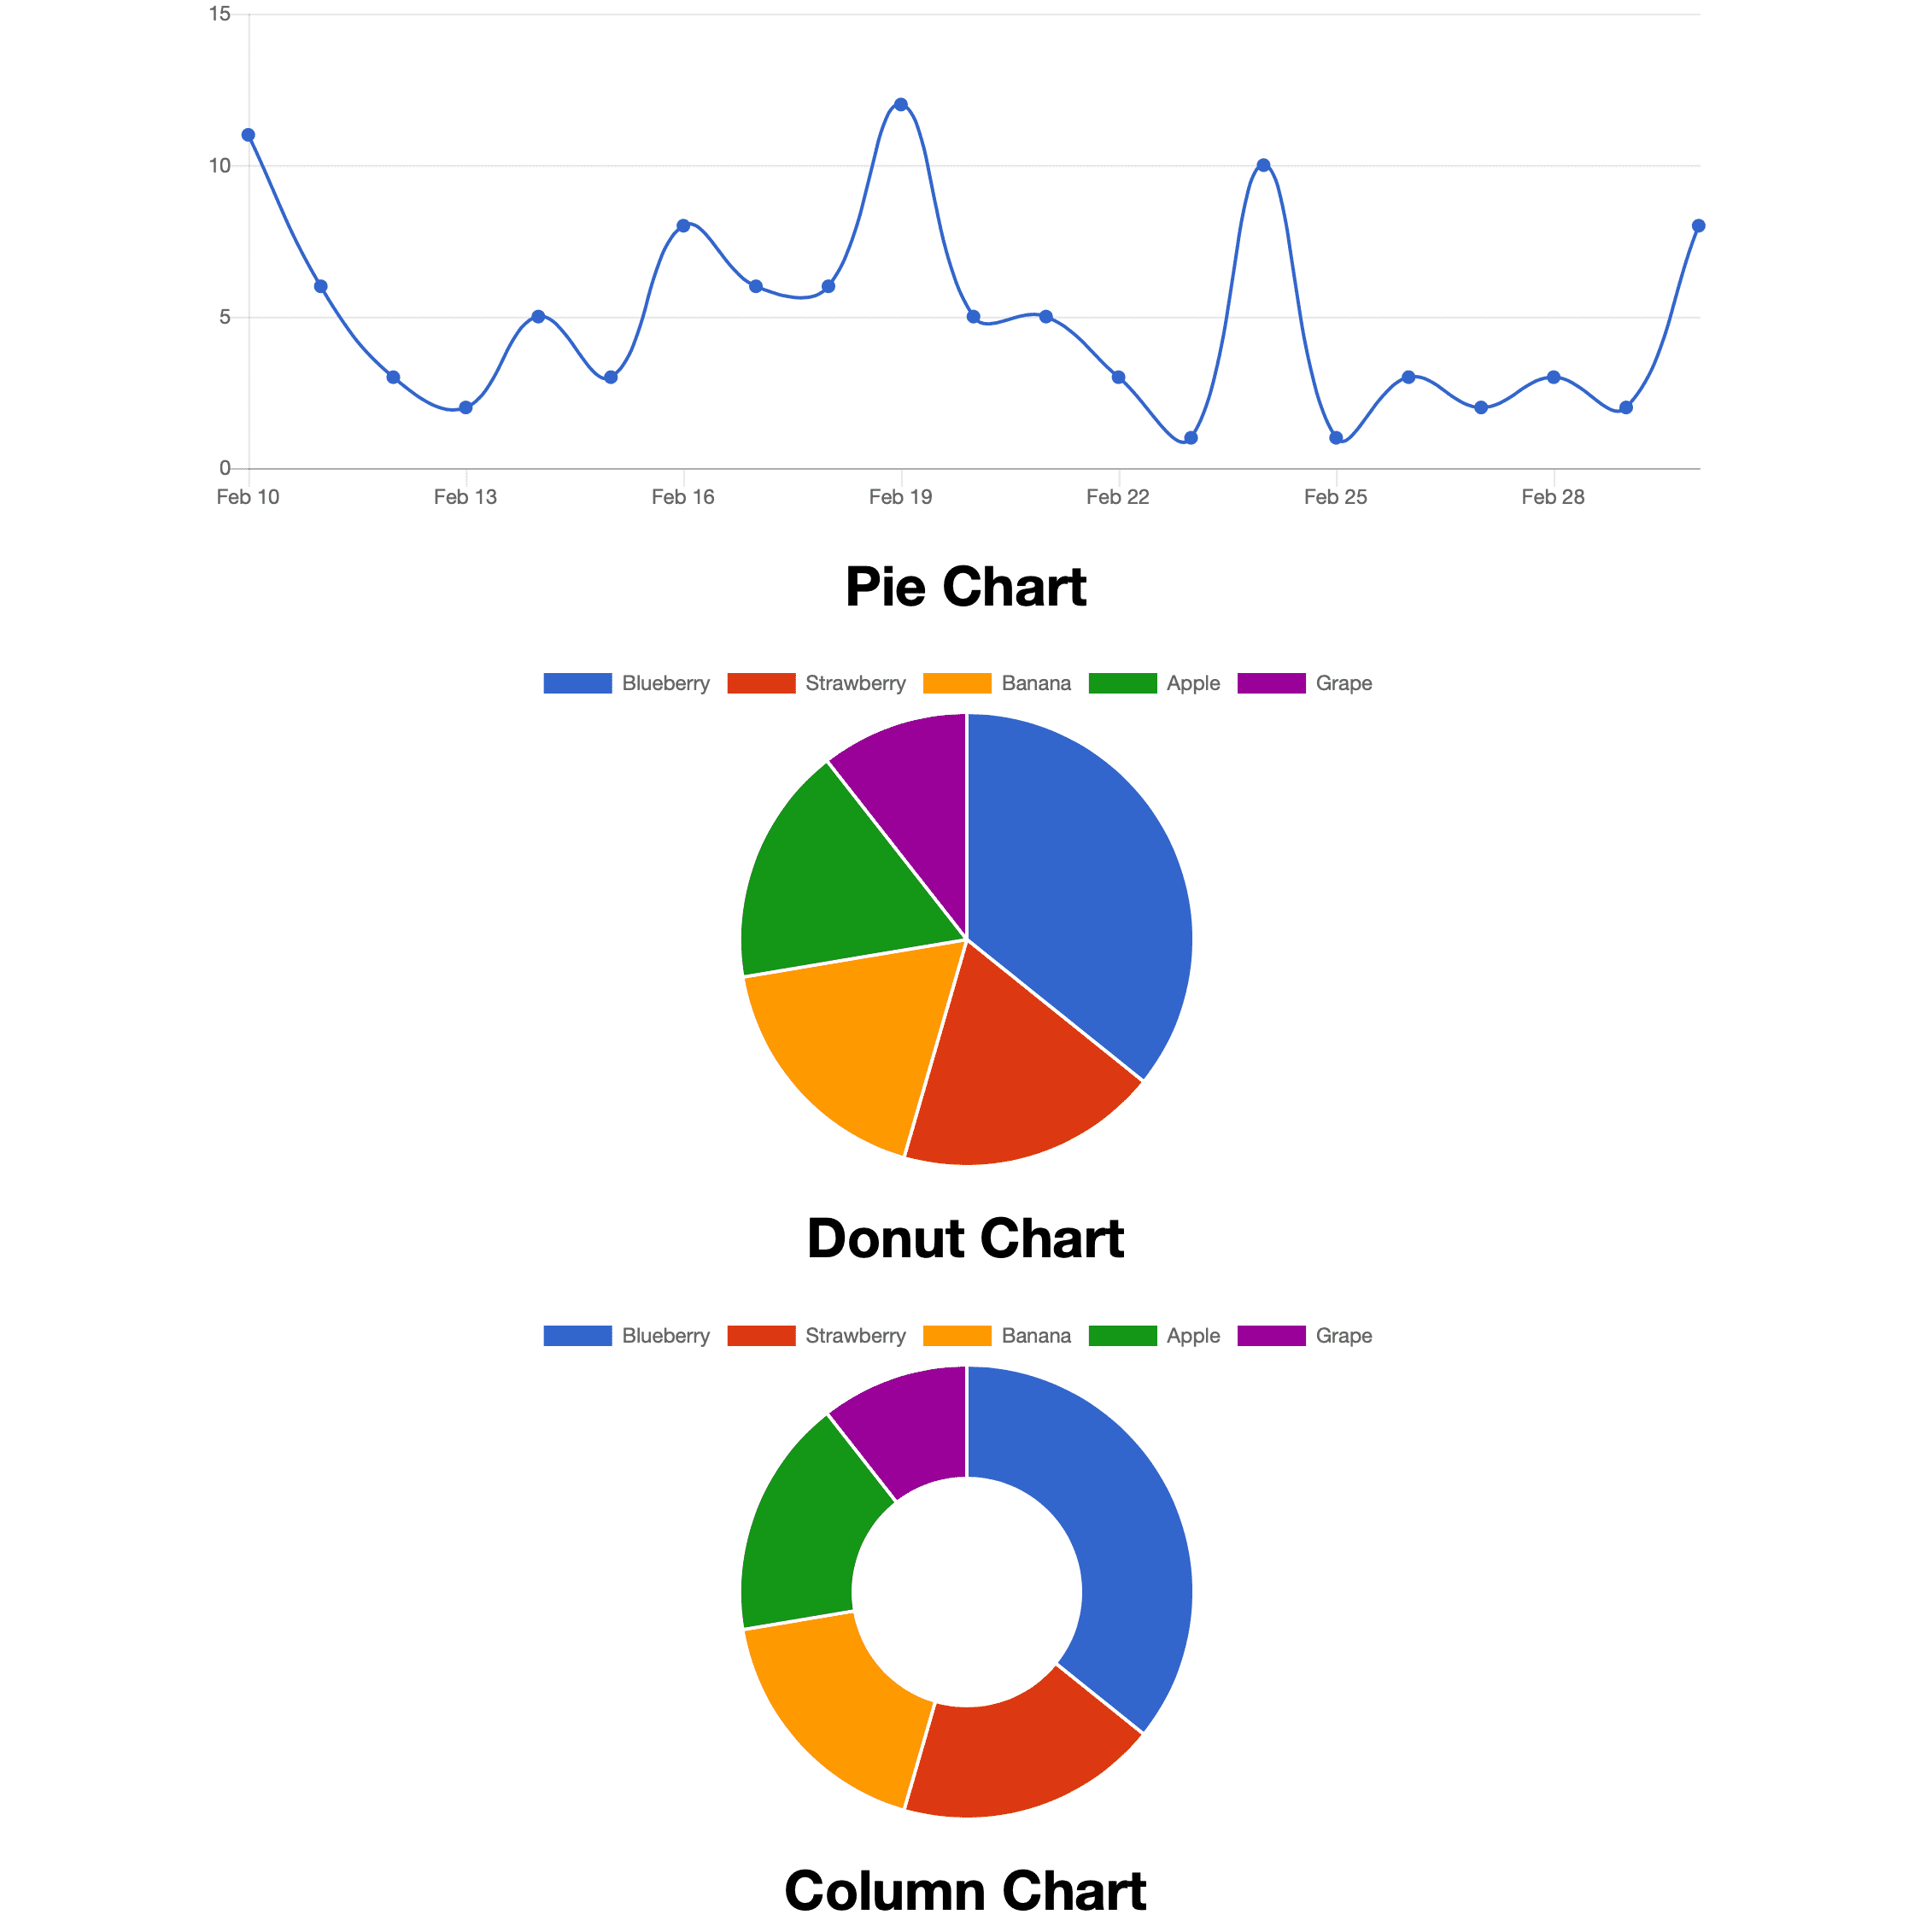
JavaScript/JS
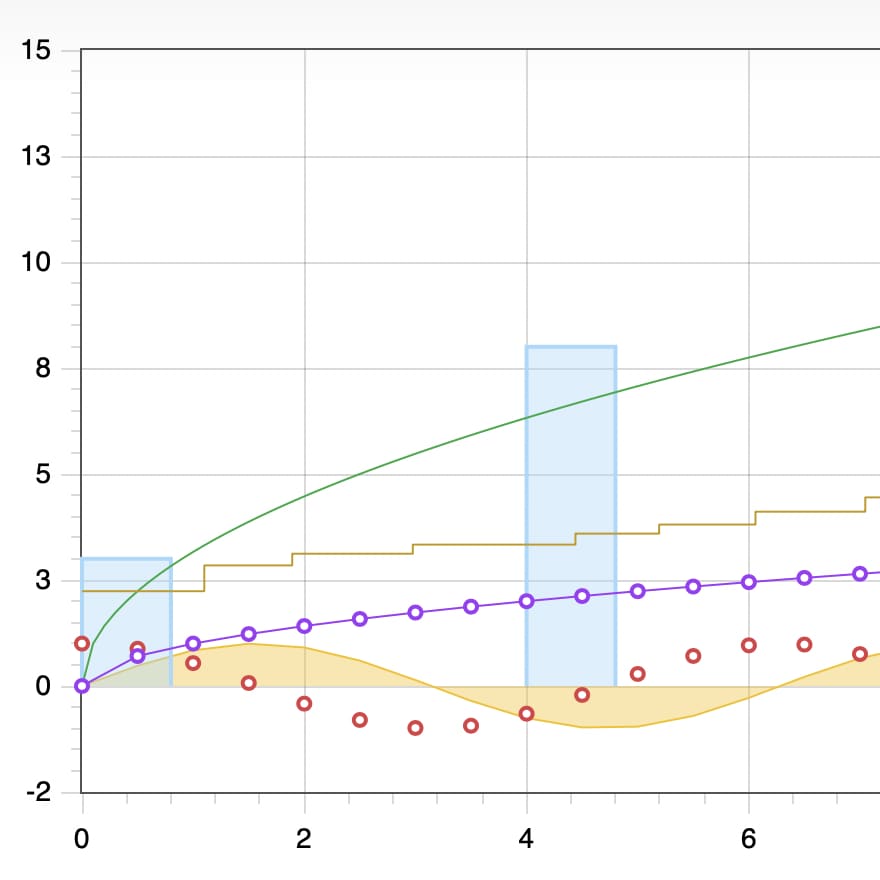
Flexible JavaScript charting for designers and developers; mix and match bar and line charts to provide a clear visual distinction between datasets.

JavaScript/JS minified easy React zrender
Built with support from the Apache Software Foundation, ECharts lets you create intuitive, interactive, and highly customizable visualizations.

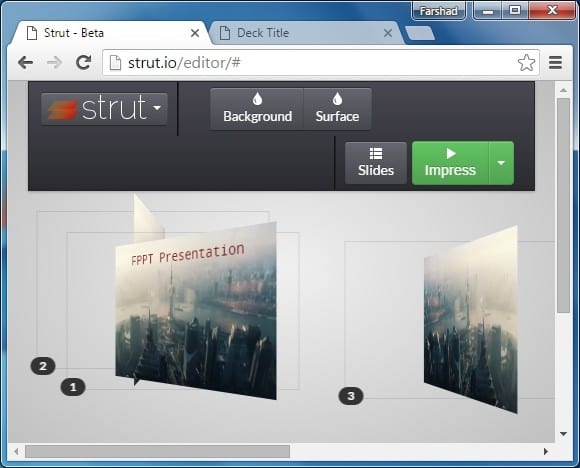
JavaScript/JS microinteractions µ presentations
Impress is an interactive presentation framework based on CSS3; it was inspired by the idea behind prezi.com.

JavaScript/JS WebGL animation game gaming sprites minified microinteractions µ system dynamics explainables explorables scenario-based
A fast, lightweight 2D visualization library featuring hardware acceleration without requiring prior knowledge of WebGL.
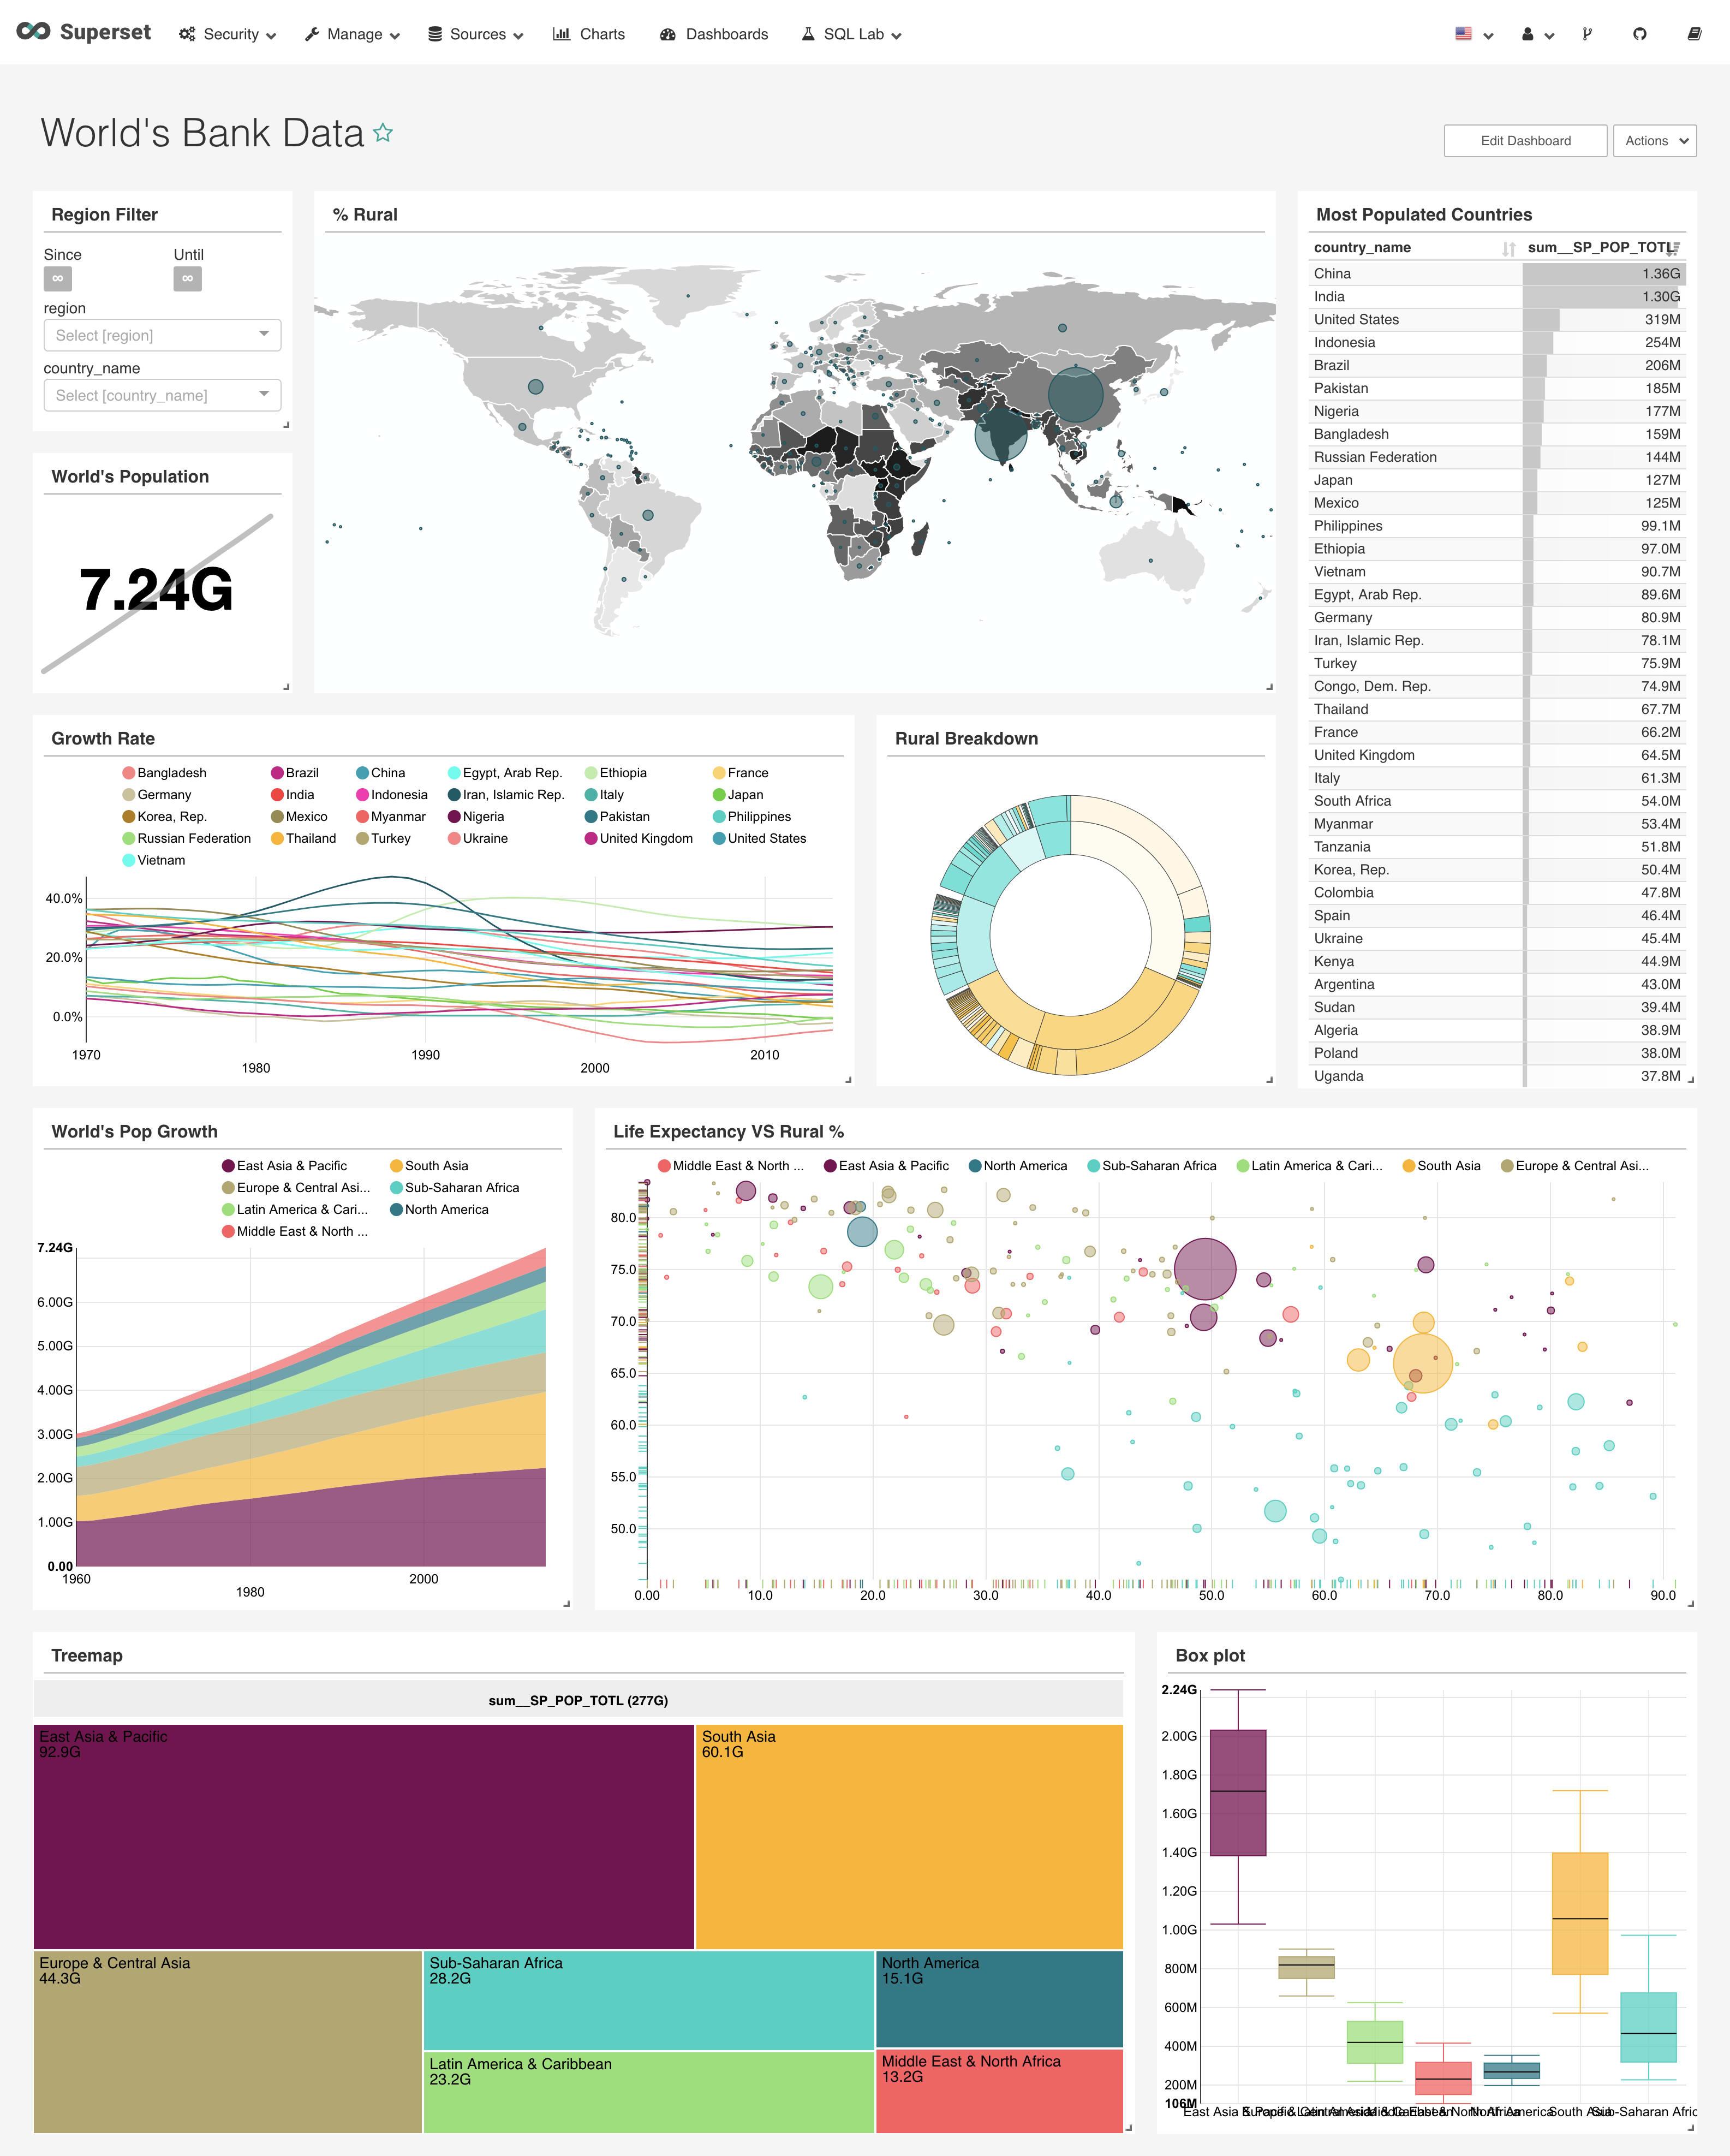
JavaScript/JS Python dashboard bigdata WebGL
Apache Superset is a modern, enterprise-ready business intelligence (BI) visualization application. View dashboards, slice and dice your data, query and visualize results data with SQL Lab, deck.gl, and native chart templates.
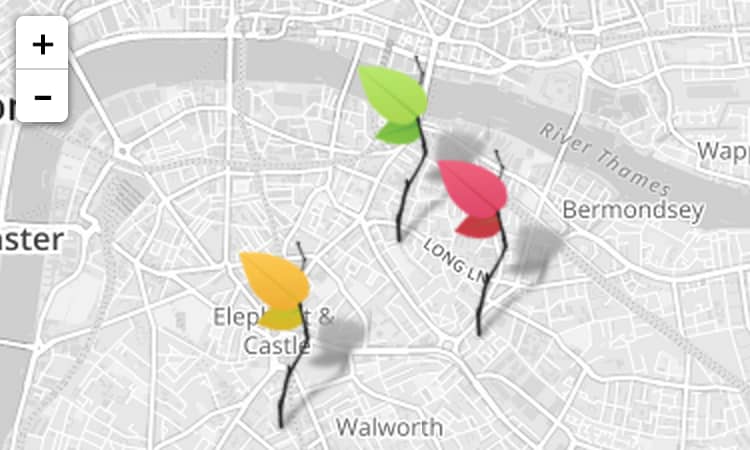
JavaScript/JS Leaflet minified
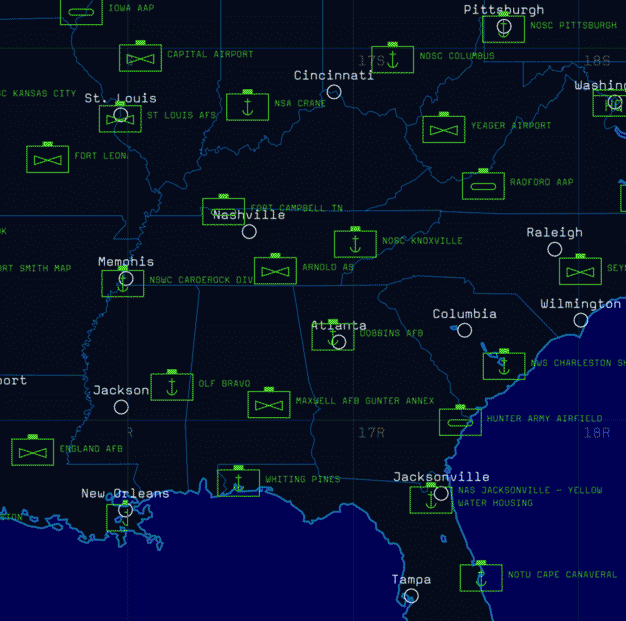
Leaflet is the leading open-source JavaScript library for mobile-friendly interactive maps, weighing in at just about 37 KB gzipped and taking advantage of HTML5 and CSS3 on modern browsers and older ones too.
Swift iOS tvOS OSX Android
Generate beautiful, performant charts for iOS/tvOS/OSX. As the Apple equivalent of MPAndroidChart, Charts allows developers to save time in developing interactive mobile app visualizations.
Clojure JavaScript/JS
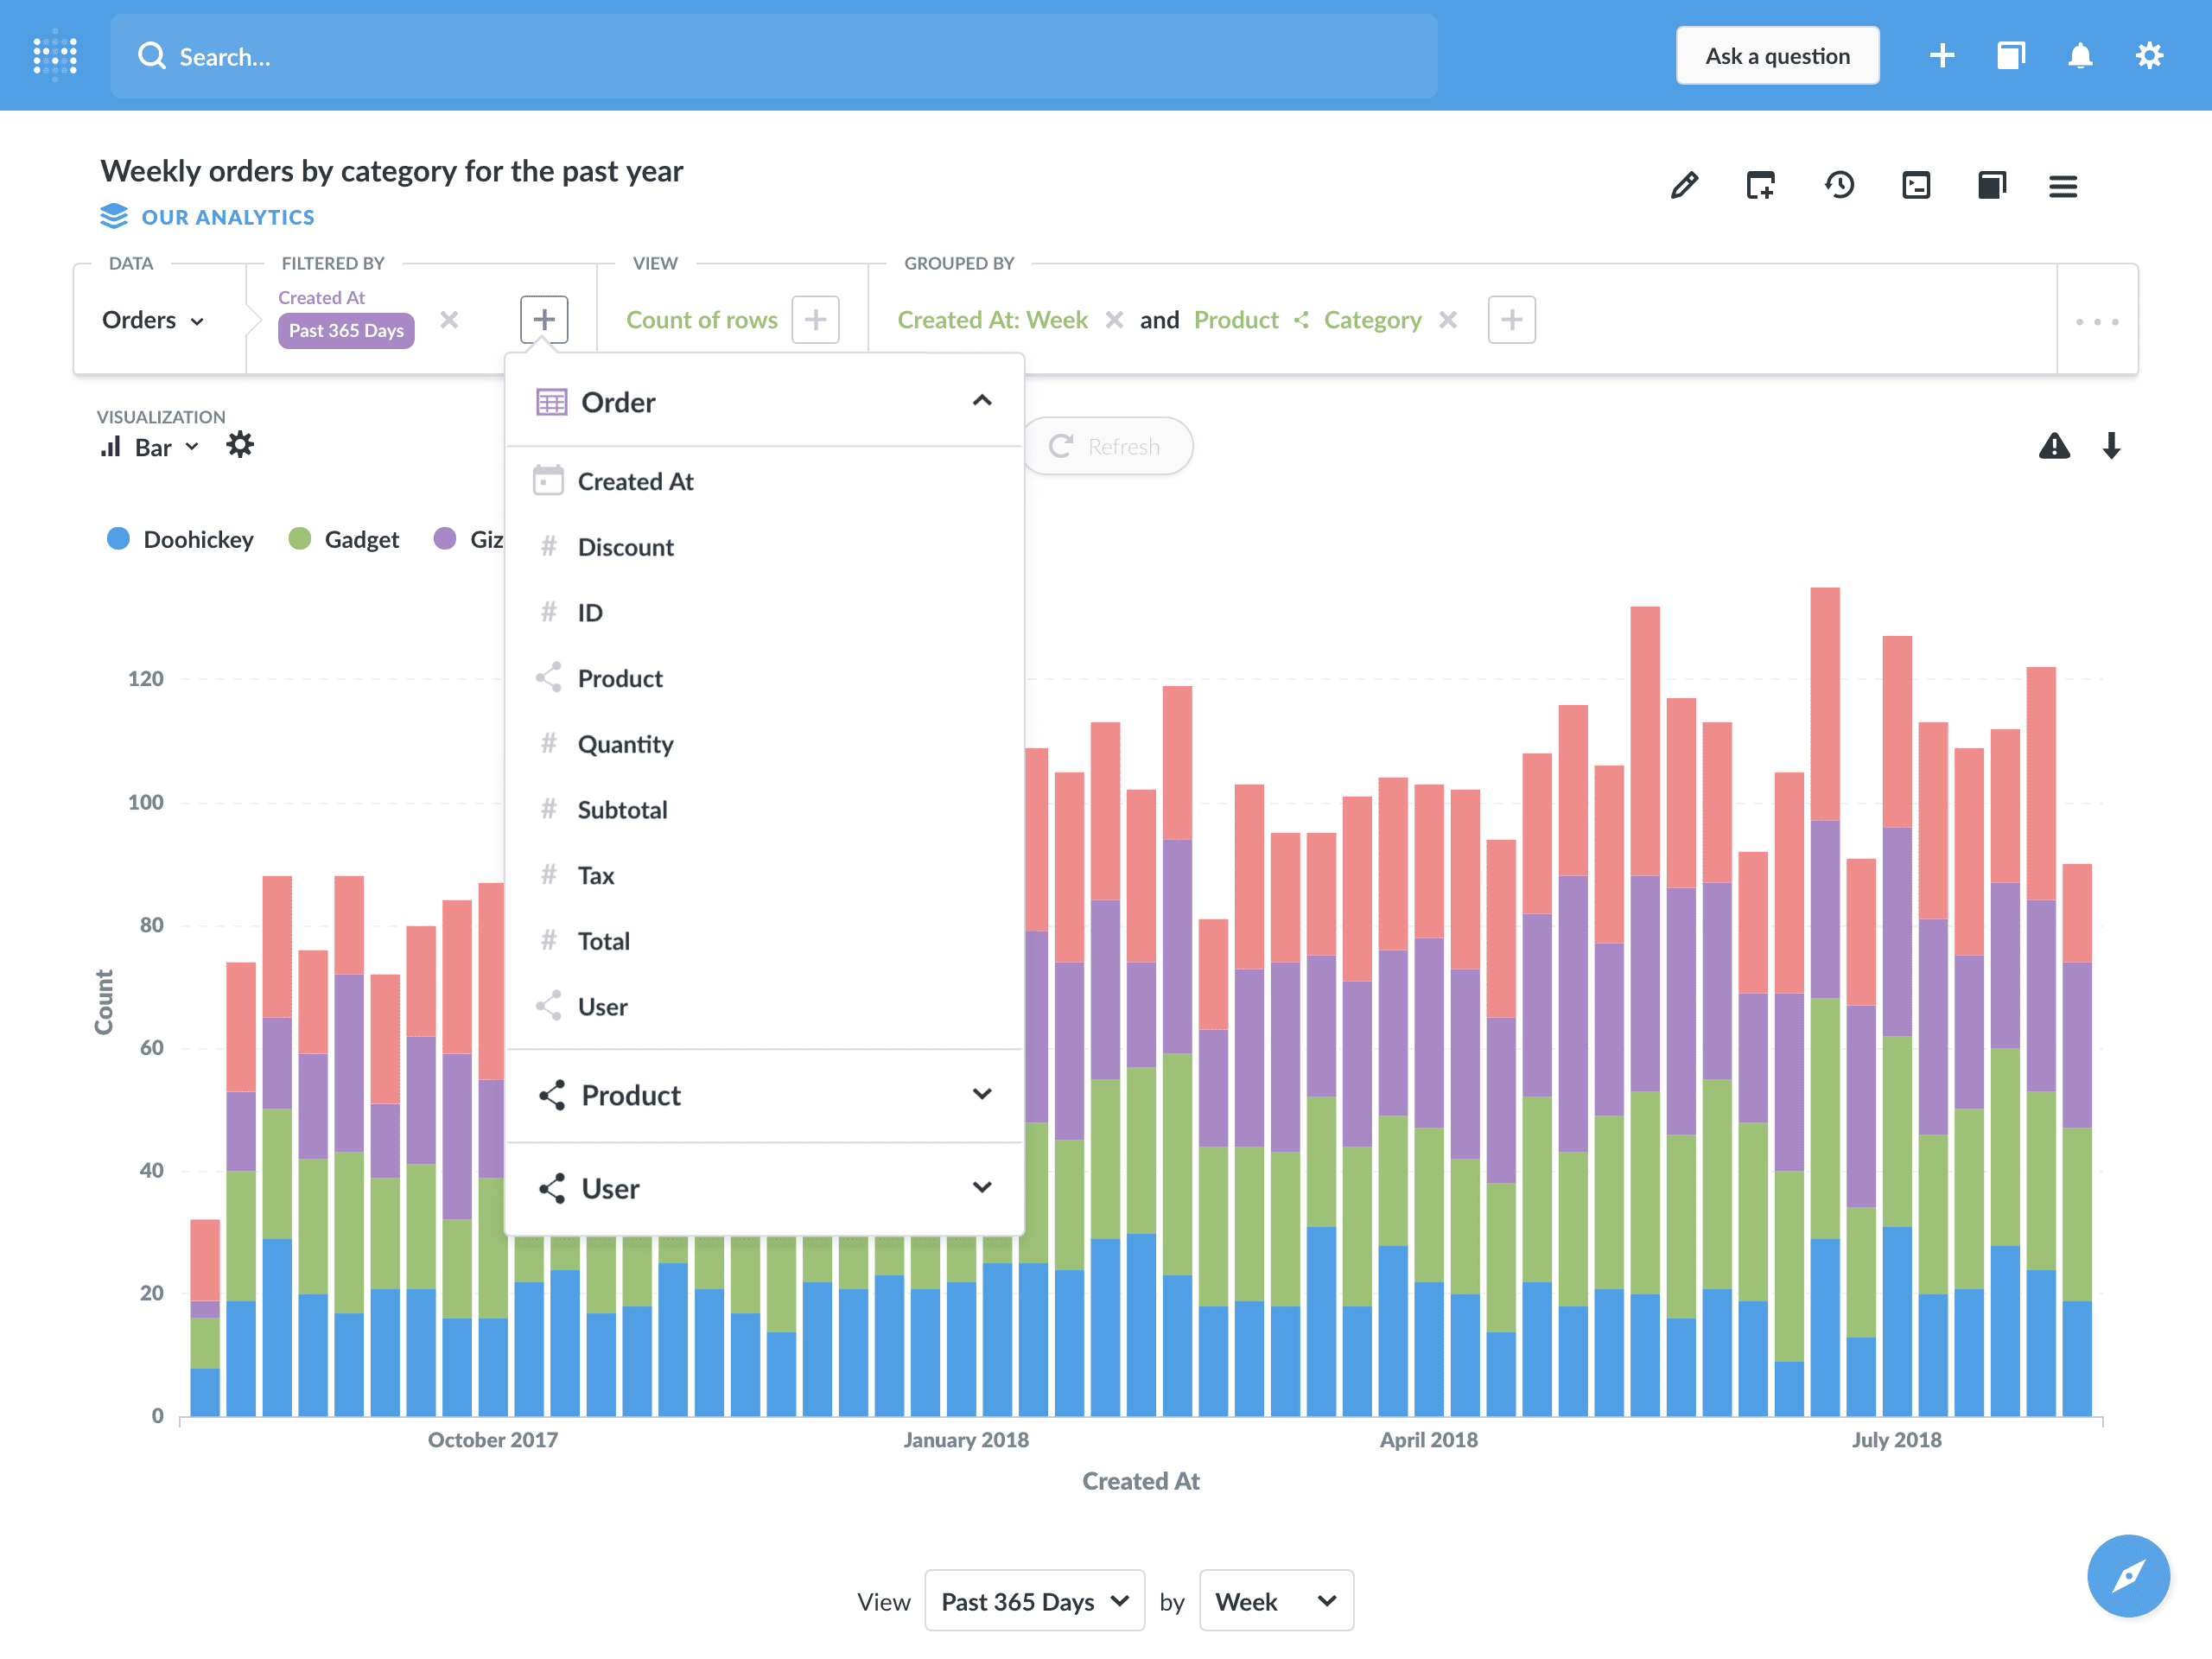
Easily filter, group, and visualize your data to find just what you're looking for without writing complicated SQL queries; see connections between data points, and output results in chart form with relatively little effort.

JavaScript/JS D3 React
Recharts is a Redefined chart library built with React and D3. The main purpose of this library is to help you to write charts in React applications without any pain.

Python
Bokeh is an interactive visualization library for Python that enables beautiful and meaningful visual presentation of data in modern web browsers. With Bokeh, you can quickly and easily create interactive plots, dashboards, and data applications.
JavaScript/JS random minified
Simple, responsive, modern SVG Charts with zero dependencies; highlighed as one of five "Cool New Open Source Projects" in the 2018 GitHub State of the Octoverse report.

JavaScript/JS
Based on the core principles of Processingm, p5.js is a client-side JS platform that empowers artists, designers, students, and anyone interested in creative coding/interactive visualization.
JavaScript/JS Angular React minified
Simple, responsive SVG charts with clear separation of concerns (style with CSS and control with JS), configuration overrides based on media queries, and animation capability.

Python Plotly React Flask
Dash is a Python framework for building analytical web applications. Build on top of Plotly.js, React, and Flask, and tie UI elements like dropdowns, sliders, and graphs directly to analytical Python code.

JavaScript/JS software version control source code
Quickly visualize the history of a file from any git repository; nothing to download or install; simply point Git History to a repository file URL in order to view source code revisions over time.
JavaScript/JS D3 GL
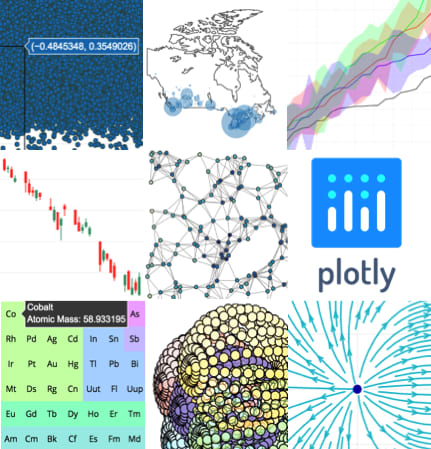
Built on top of d3.js and stack.gl, plotly.js is a high-level, declarative charting library. plotly.js ships with over 30 chart types, including scientific charts, 3D graphs, statistical charts, SVG maps, financial charts, and more.
JavaScript/JS microinteractions µ utilities
Paper.js is an open source vector graphics scripting framework that runs on top of the HTML5 Canvas, featuring a clean Scene Graph / Document Object Model.

Python
Matplotlib is a Python 2D plotting library which produces publication quality figures in a variety of hardcopy formats and interactive environments across platforms.

JavaScript/JS Vive Rift Daydream GearVR WebGL animation microinteractions µ
A web framework for building virtual reality experiences. Make WebVR with HTML and Entity-Component. Works on Vive, Rift, Daydream, GearVR, and desktop.

Python content natural language processing NLP
Gensim is an extensively documented Python library built for topic modelling, document indexing, and similarity retrieval across large text corpora; it also generates useful topic model visualizations.
JavaScript/JS easy
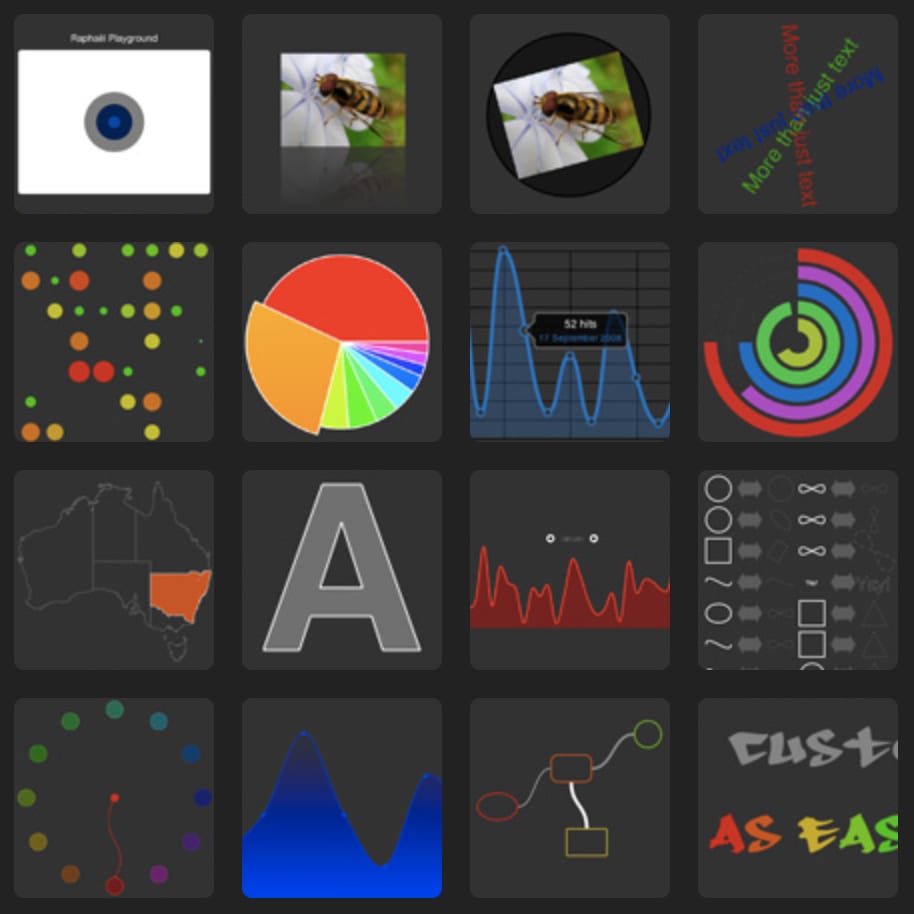
Raphaël is a small JavaScript library for web-based vector graphics. If you want to create your own specific chart or image crop and rotate widget, for example, you can implement this functionality easily.

JavaScript/JS
A simple markdown-driven in-browser slideshow tool featuring visual templates, markdown formatting, and touch support for smart phones and tablets.

JavaScript/JS
G2 is a data-driven visualization language built for usability and scalability. It provides a set of grammars, takes users beyond a limited set of charts to an almost unlimited world of graphical forms.
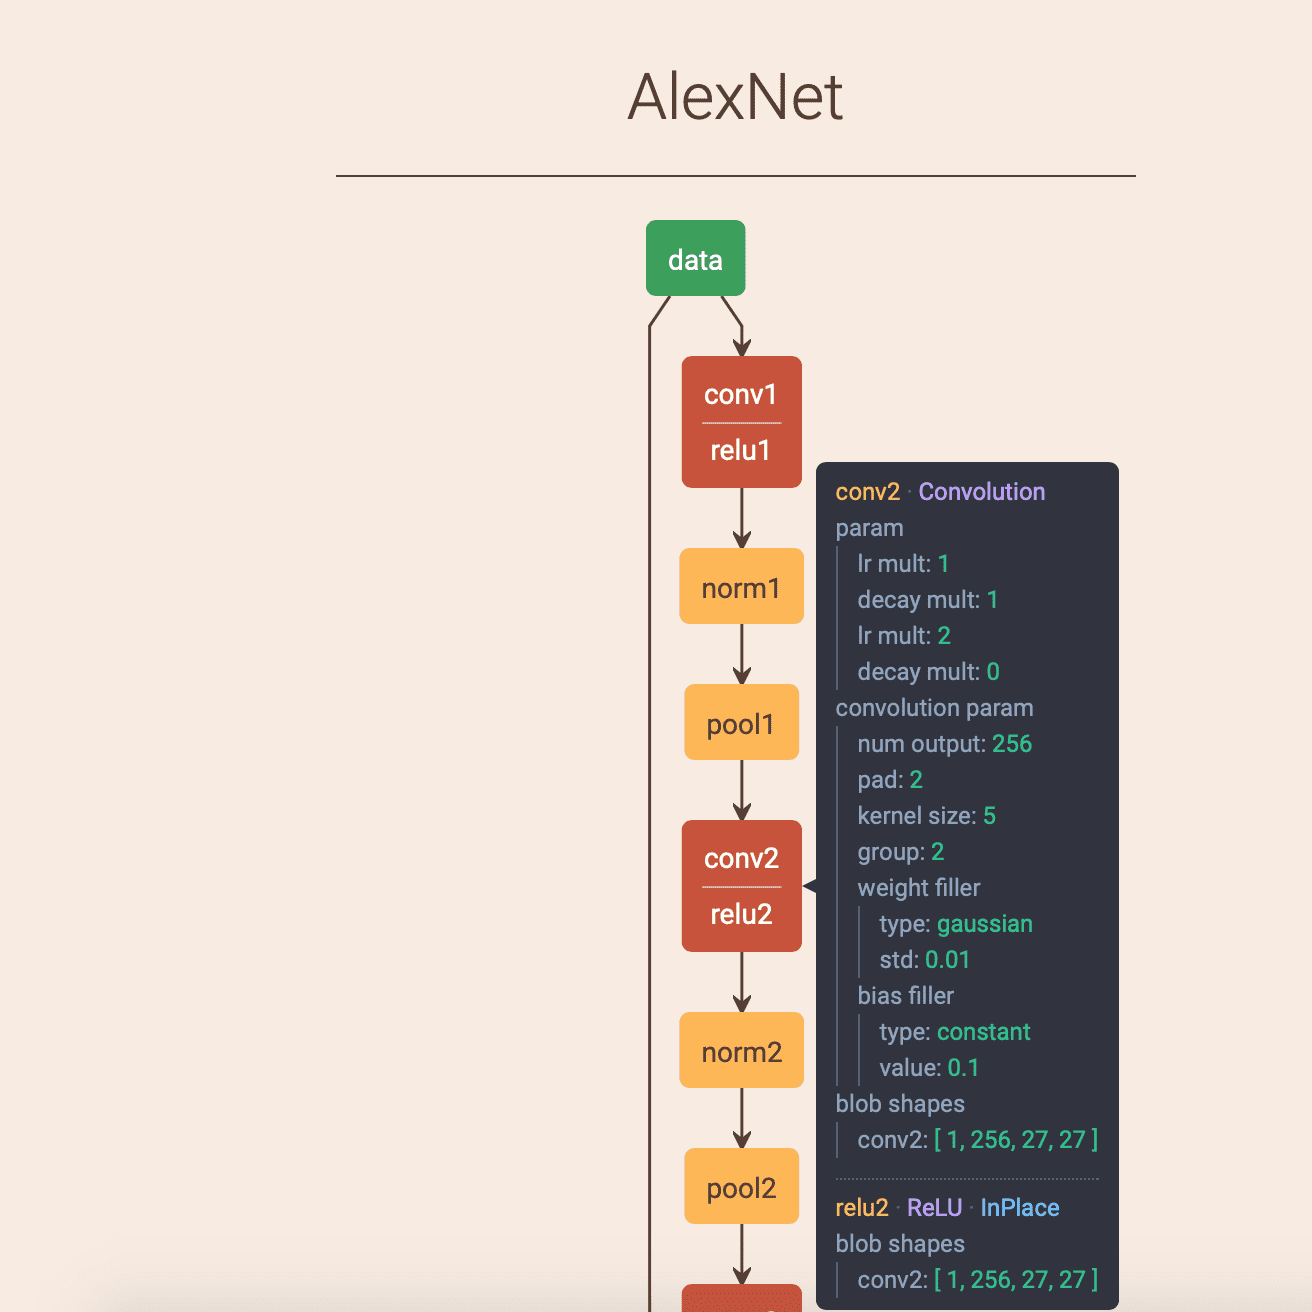
JavaScript/JS Python machine learning ML neural network ANN CNN deep learning
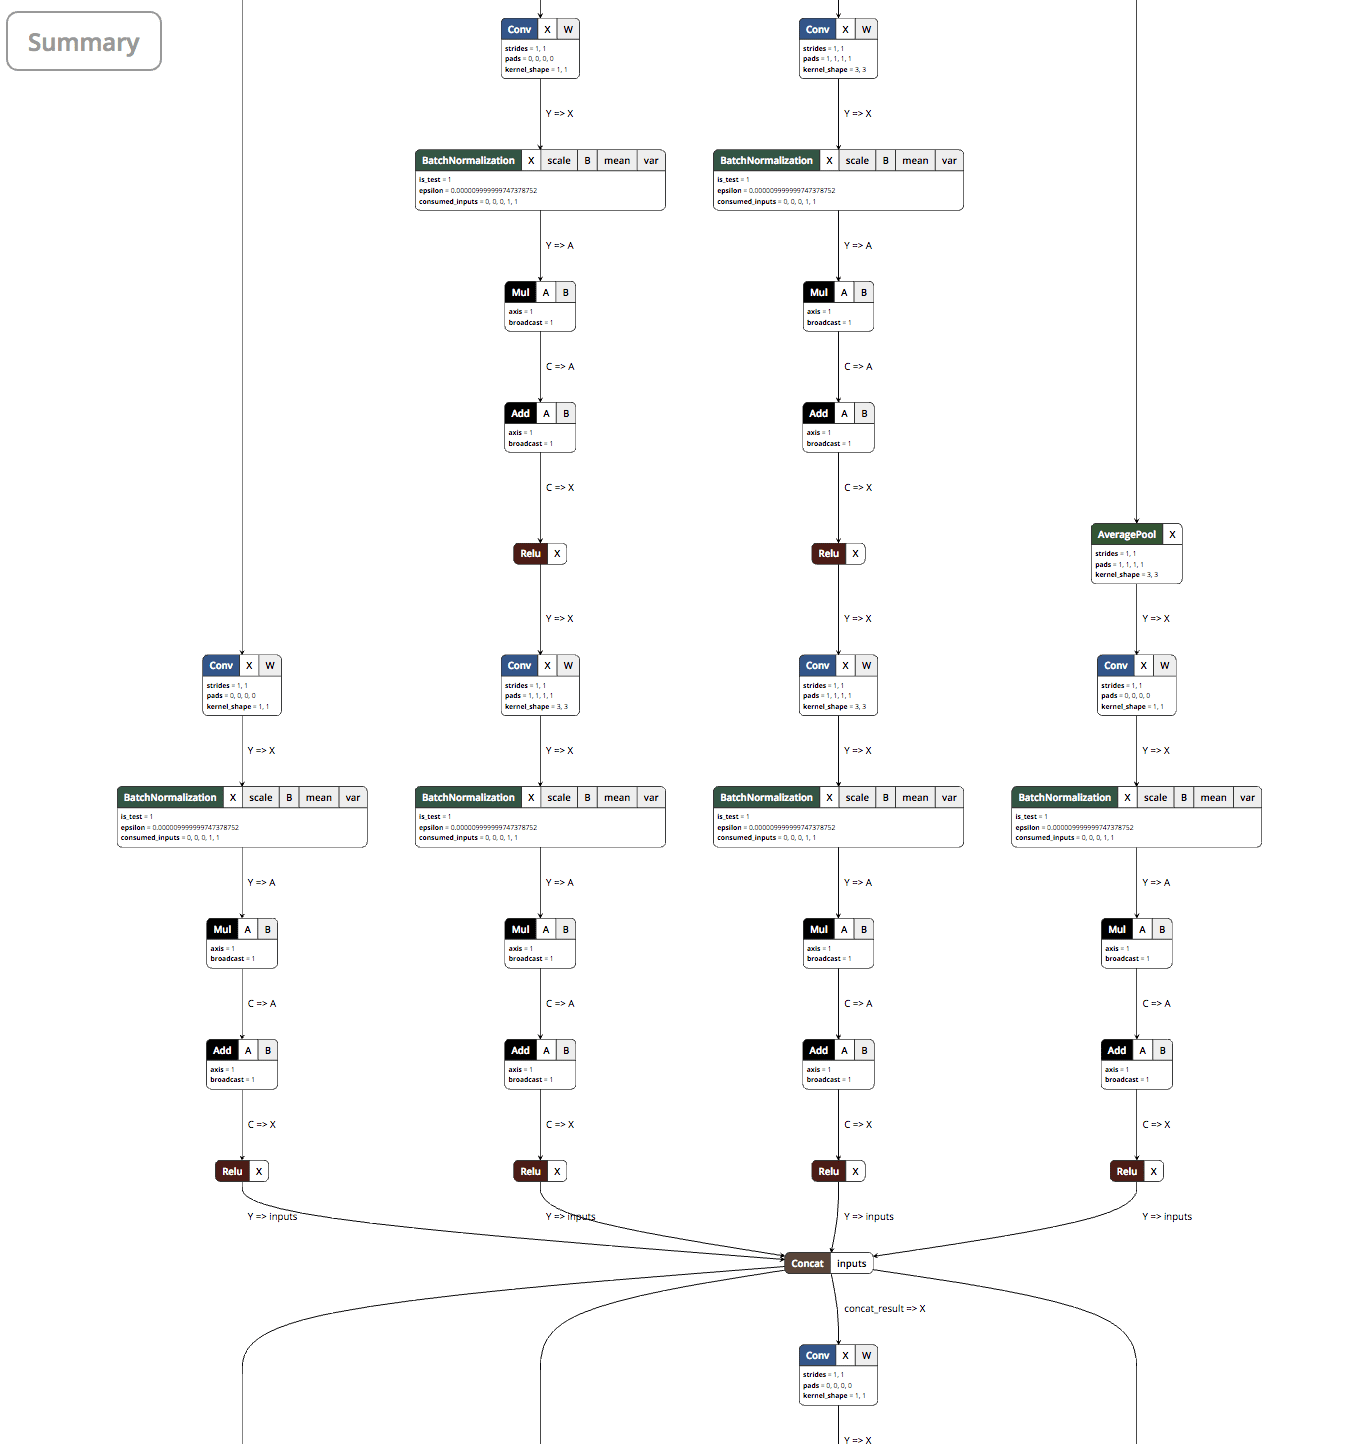
Netron is a viewer for neural network, deep learning and machine learning models. It runs on macOS, Windows, Linux, in the browser, or can serve models via a local Python web server.
JavaScript/JS graph
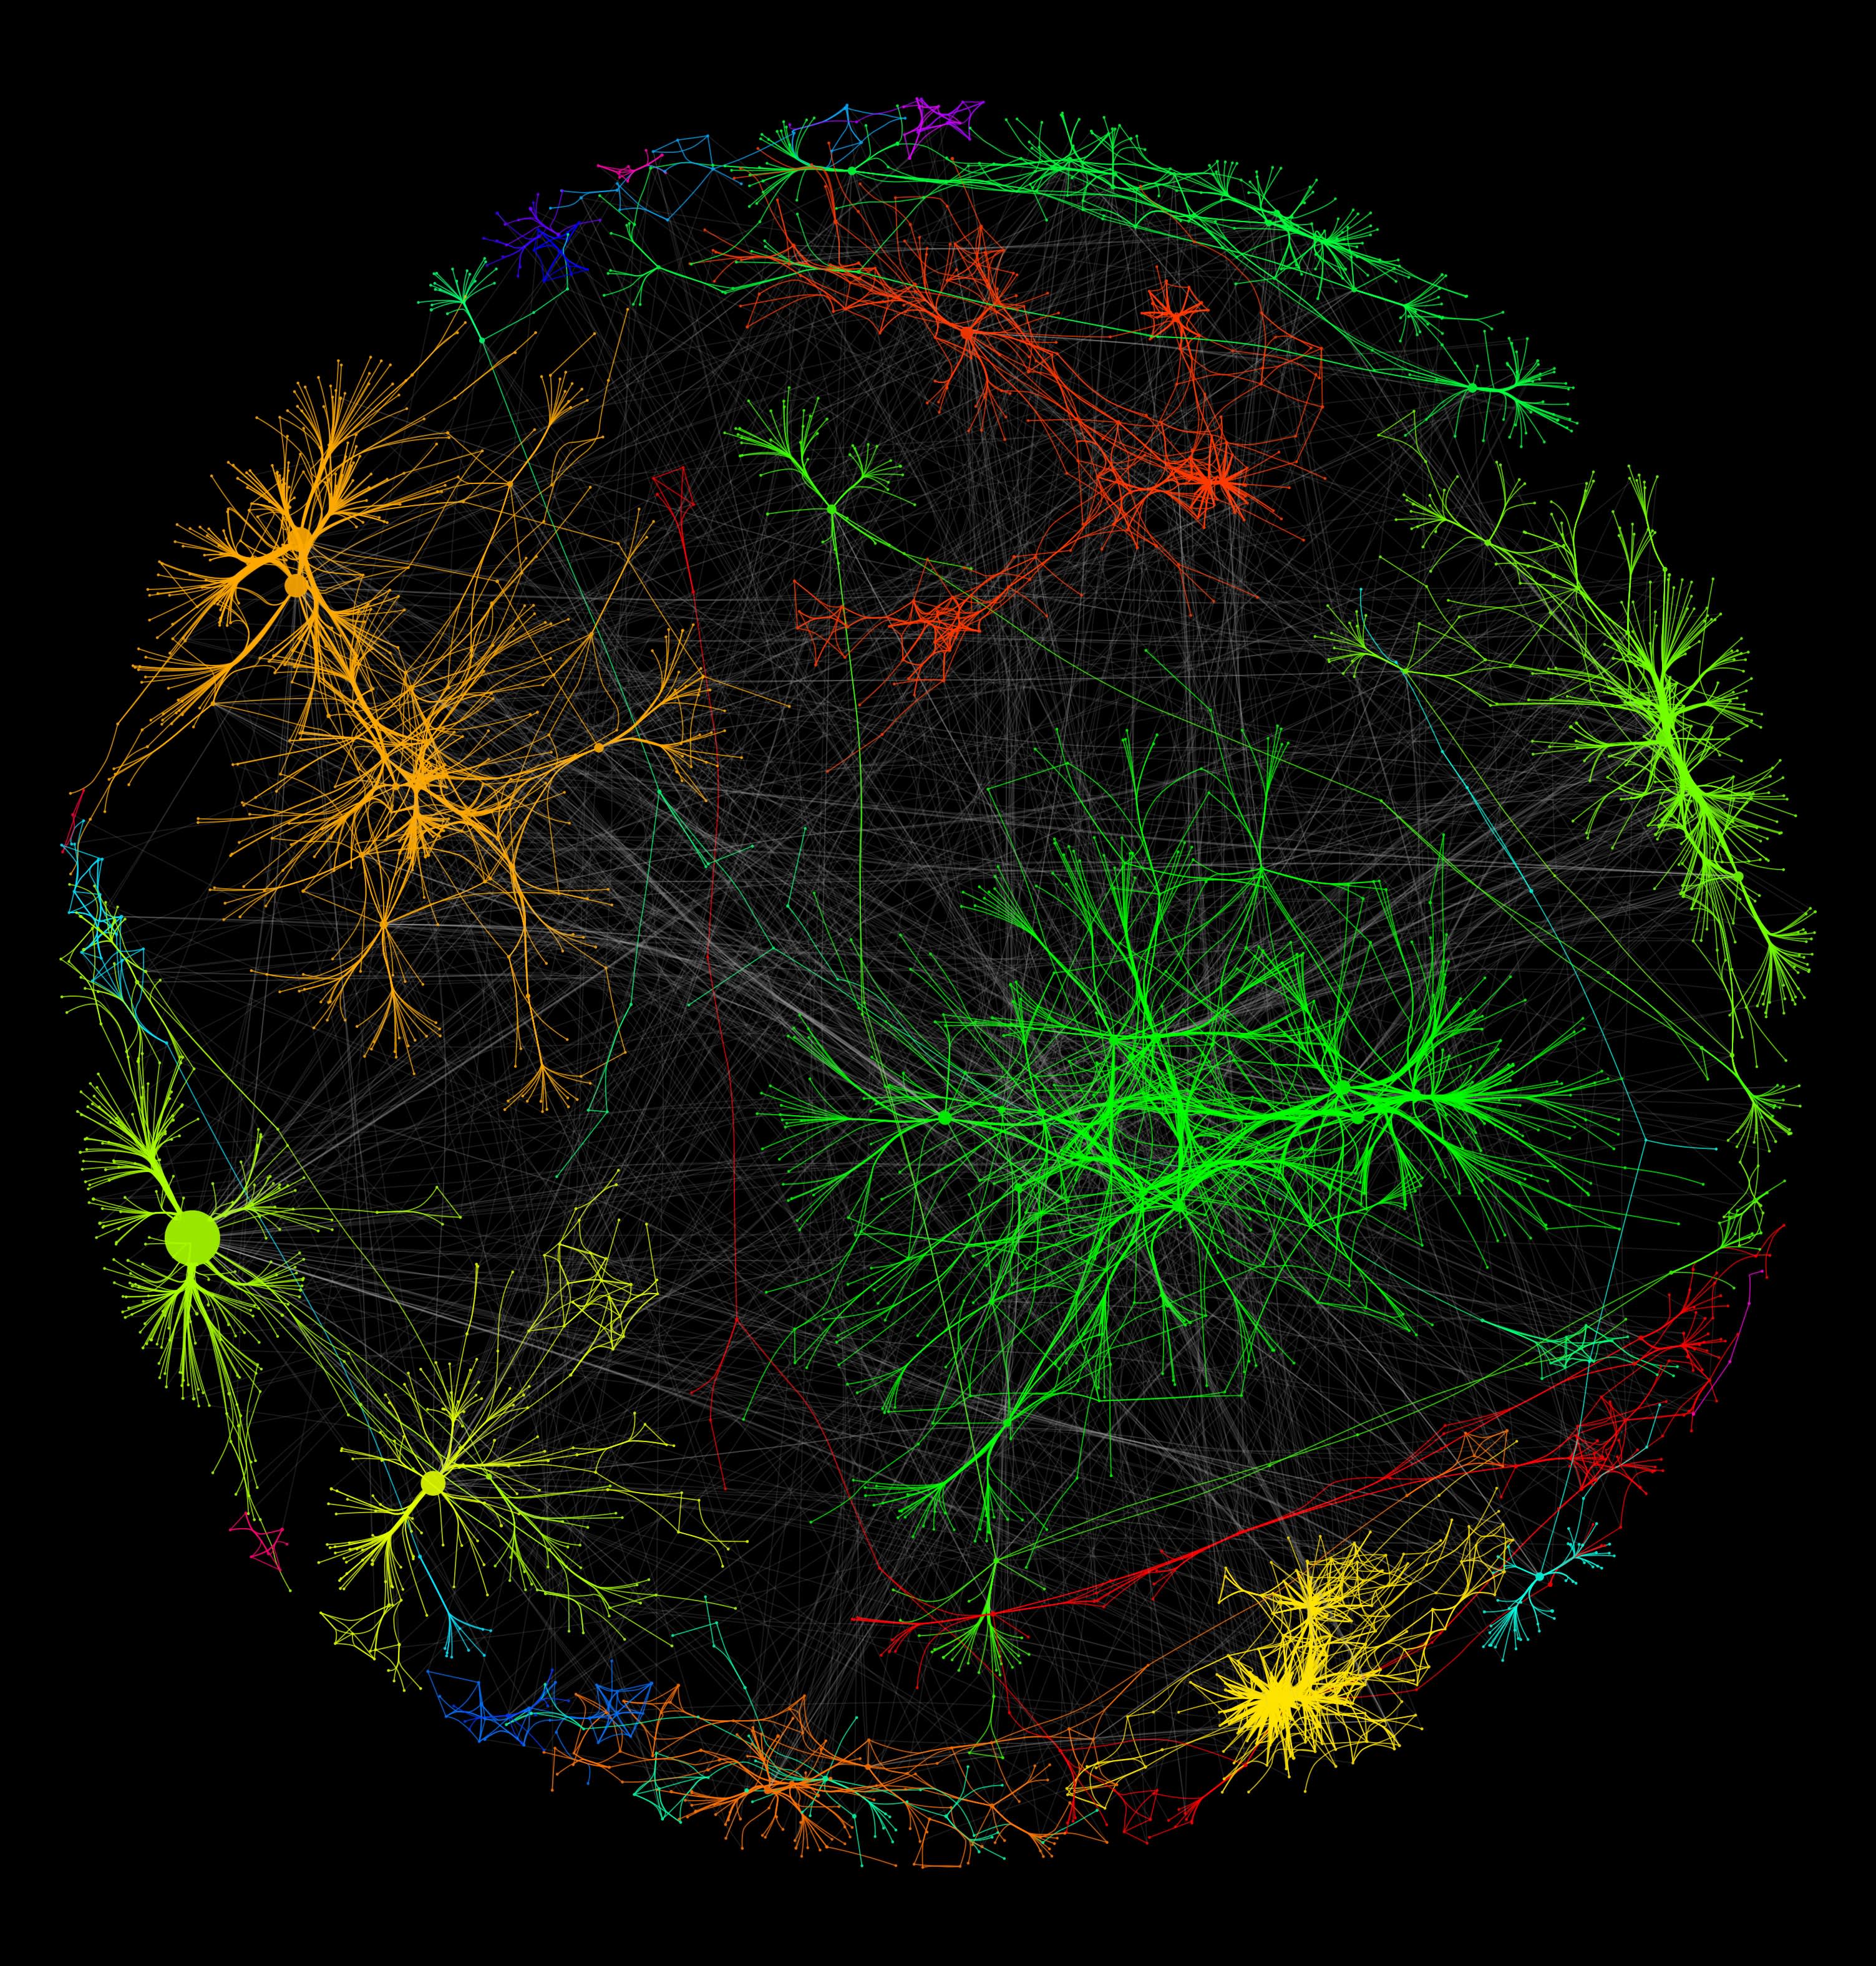
Sigma is a JavaScript library dedicated to graph drawing. It makes easy to publish networks on Web pages, and allows developers to integrate network exploration in rich Web applications.

Python natural language processing NLP sentence diagramming treebanks
NLTK -- the Natural Language Toolkit -- is a suite of open source Python modules, data sets, and tutorials supporting research, development, and visualization in Natural Language Processing (NLP).

JavaScript/JS
ApexCharts is a modern open-source charting library that helps developers to create flexible, performant, and interactive visualizations for their web pages; features extensively documented APIs.

JavaScript/JS D3 easy
C3.js D3-based reusable chart library Comfortable - C3 makes it easy to generate D3-based charts by wrapping the code required to construct the entire chart.

JavaScript/JS presentation
NodePPT is a simple JavaScript-based Web presentation tool with native markdown-to-slides conversion, CSS Syntax, templates, and extensive customization options.

JavaScript/JS Vega time series
Vega is a declarative format for creating, saving, and sharing interactive visualizations. With Vega, you can specify visualizations in JSON format, and generate interactive views using Canvas or SVG.

Python terminal documentation security logs terminal
Forget screen recording apps and blurry video. Record and share your terminal sessions the right way with a lightweight, purely text-based approach to terminal recording.

JavaScript/JS source code typography microinteractions µ syntax highlighting
Prism is a lightweight, extensible syntax highlighter built with modern Web standards in mind. It's used to style/decorate text on thousands of websites, including some of those you visit daily.

JavaScript/JS
A dynamic, browser-based visualization library designed to be easy to use, to handle dynamic data, and to manipulate network, timeline, 2D, 3D, and unstructured data across all major browsers.

OpenGL 3D C++ GitHub software version control source code
OpenGL-based 3D tree-based visualisation tool for source control repos (e.g. Git, Mercurial, Bazaar, and SVN), with the root of the repository at the centre, directories shown as branches, and files as leaves.

JavaScript/JS ScatterplotLayer ArcLayer TextLayer and GeoJSONLayer
deck.gl offers an extensive catalog of pre-packaged visualization "layers", including ScatterplotLayer, ArcLayer, TextLayer, and GeoJSONLayer, where layer inputs are usually JSON object arrays.
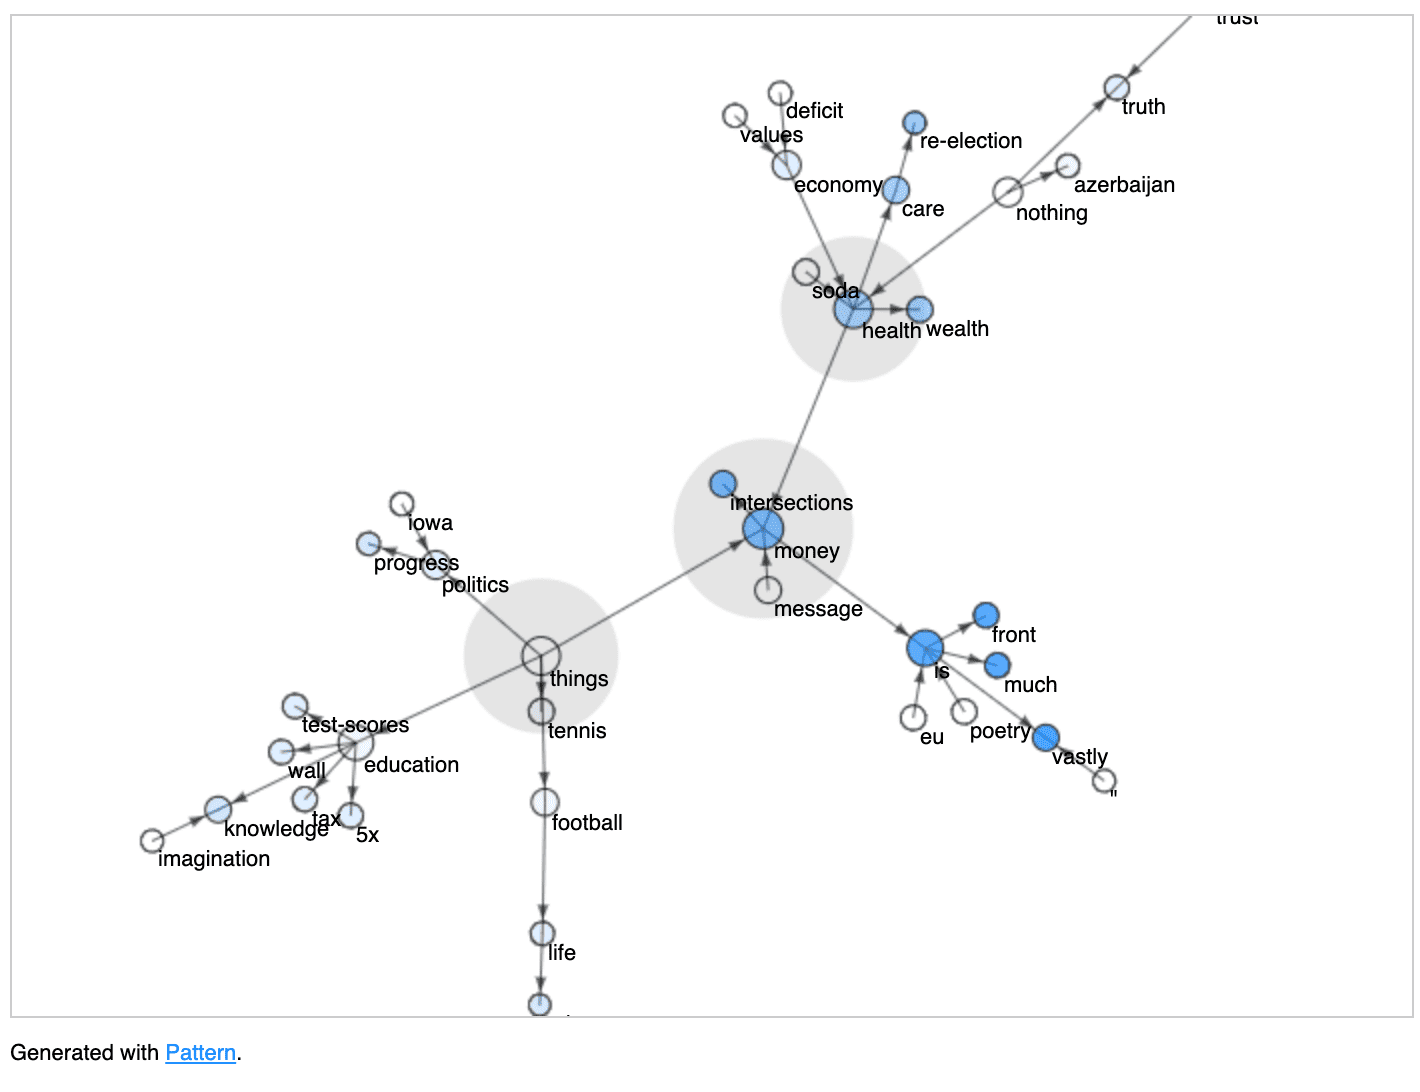
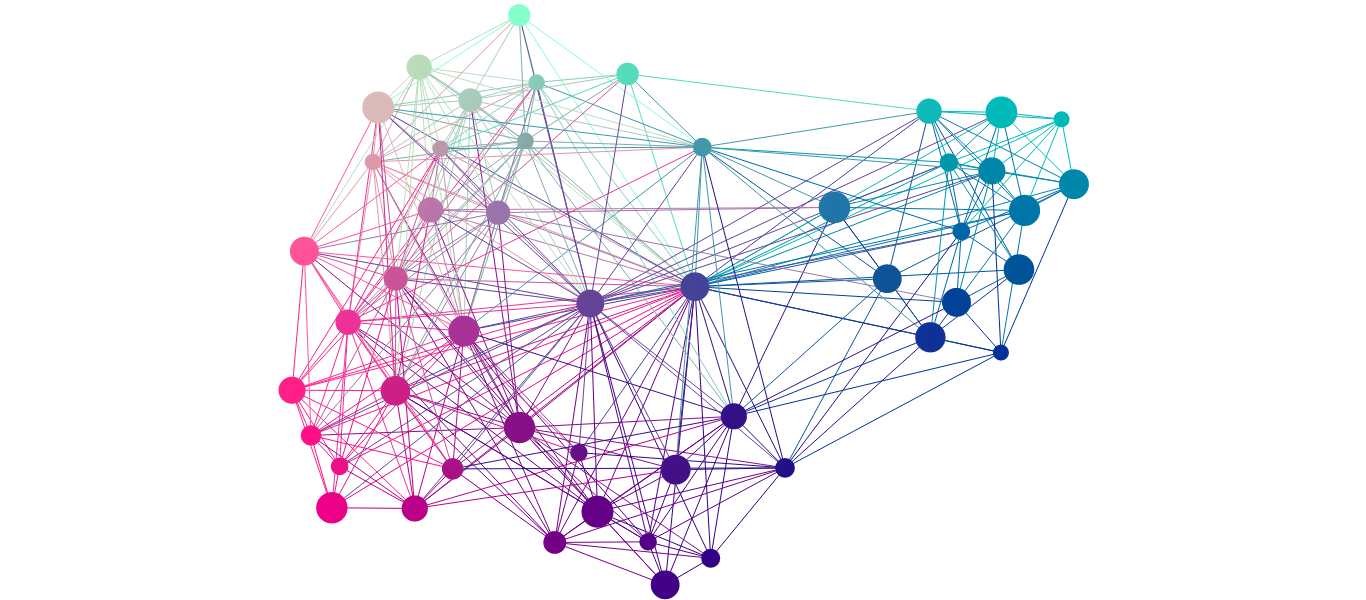
Python content natural language processing NLP sentiment
Pattern is a web mining module for the Python programming language, with part-of-speech tagging functionality, n-gram search, sentiment analysis, and <canvas> visualization functionality.

Python
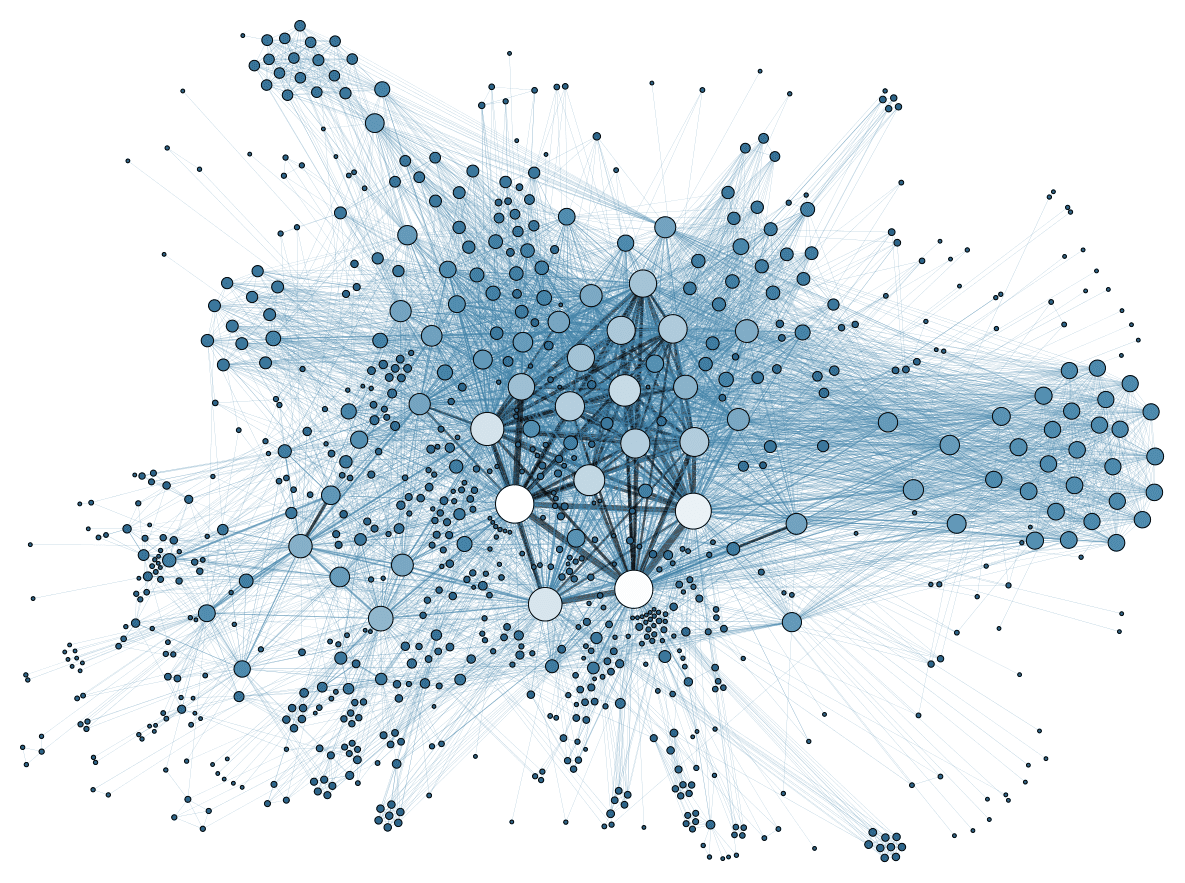
NetworkX is a Python package for creating, manipulating, and analyzing the structure, dynamics, and functions of complex networks. It can generate graphs, digraphs, and multigraphs.
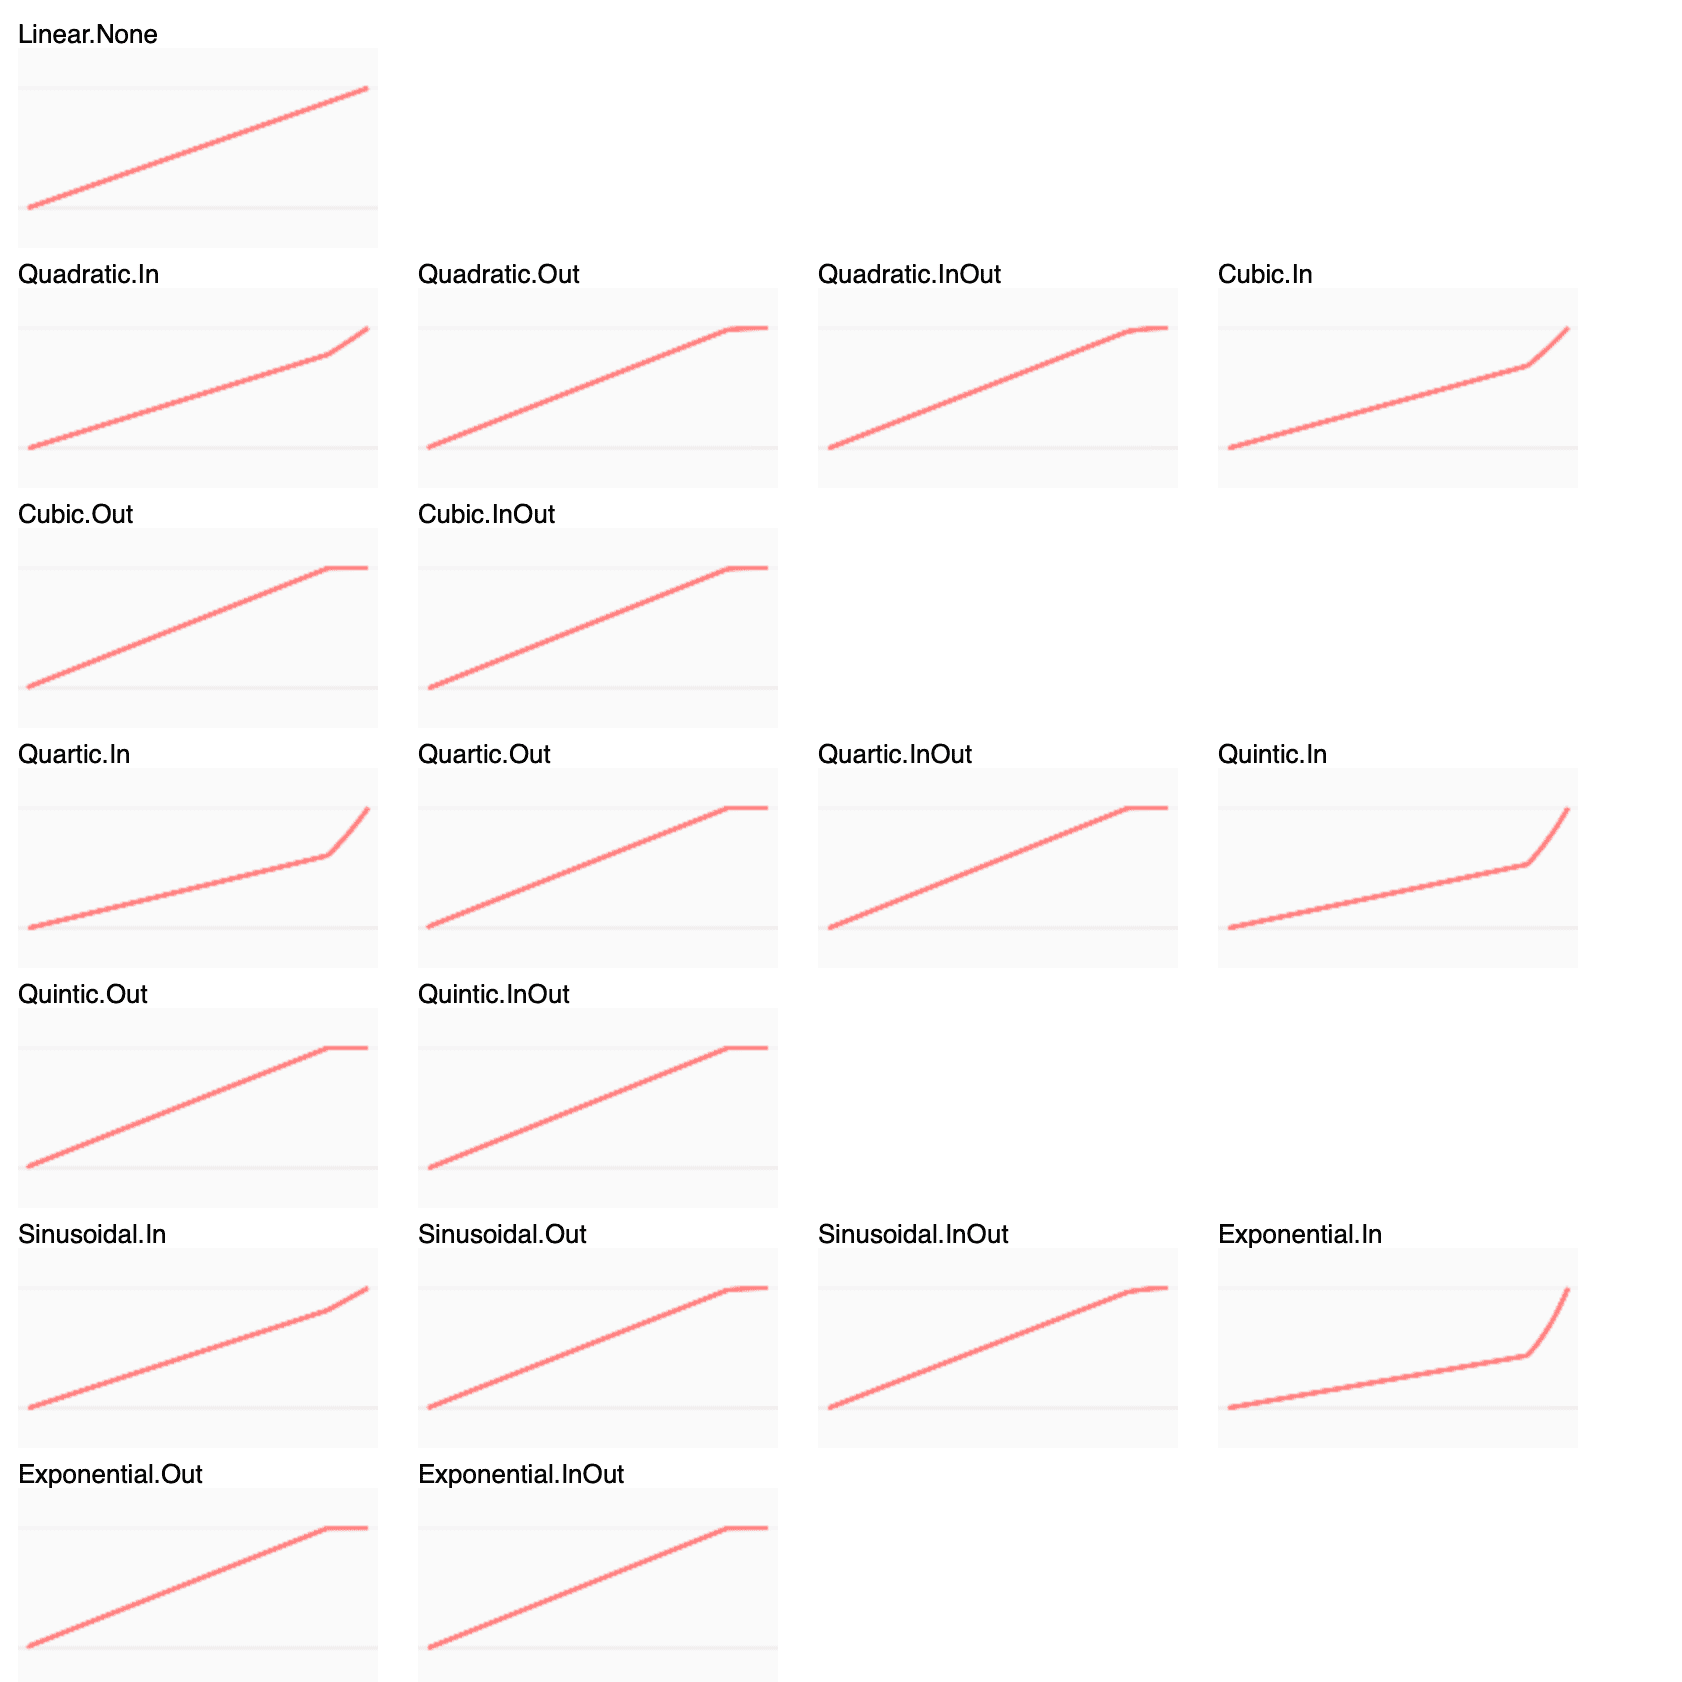
JavaScript/JS easy animations small multiples
JavaScript tweening engine for easy animations, incorporating optimised Robert Penner's equations.

Java SE
OpenRefine is a Java-based power tool that allows you to load data, understand it, clean it up, reconcile it, and augment it with data coming from the web.

Python statistics statistical
A flexible tool for creating, organizing, and sharing visualizations of live, rich data. Supports Torch and Numpy. Visdom aims to facilitate visualization of (remote) data with an emphasis on supporting scientific experimentation.

JavaScript/JS time series statistics statistical
MetricsGraphics.js is a library optimized for visualizing time series data with line charts, scatterplots, histograms, rug plots, and basic linear regression.
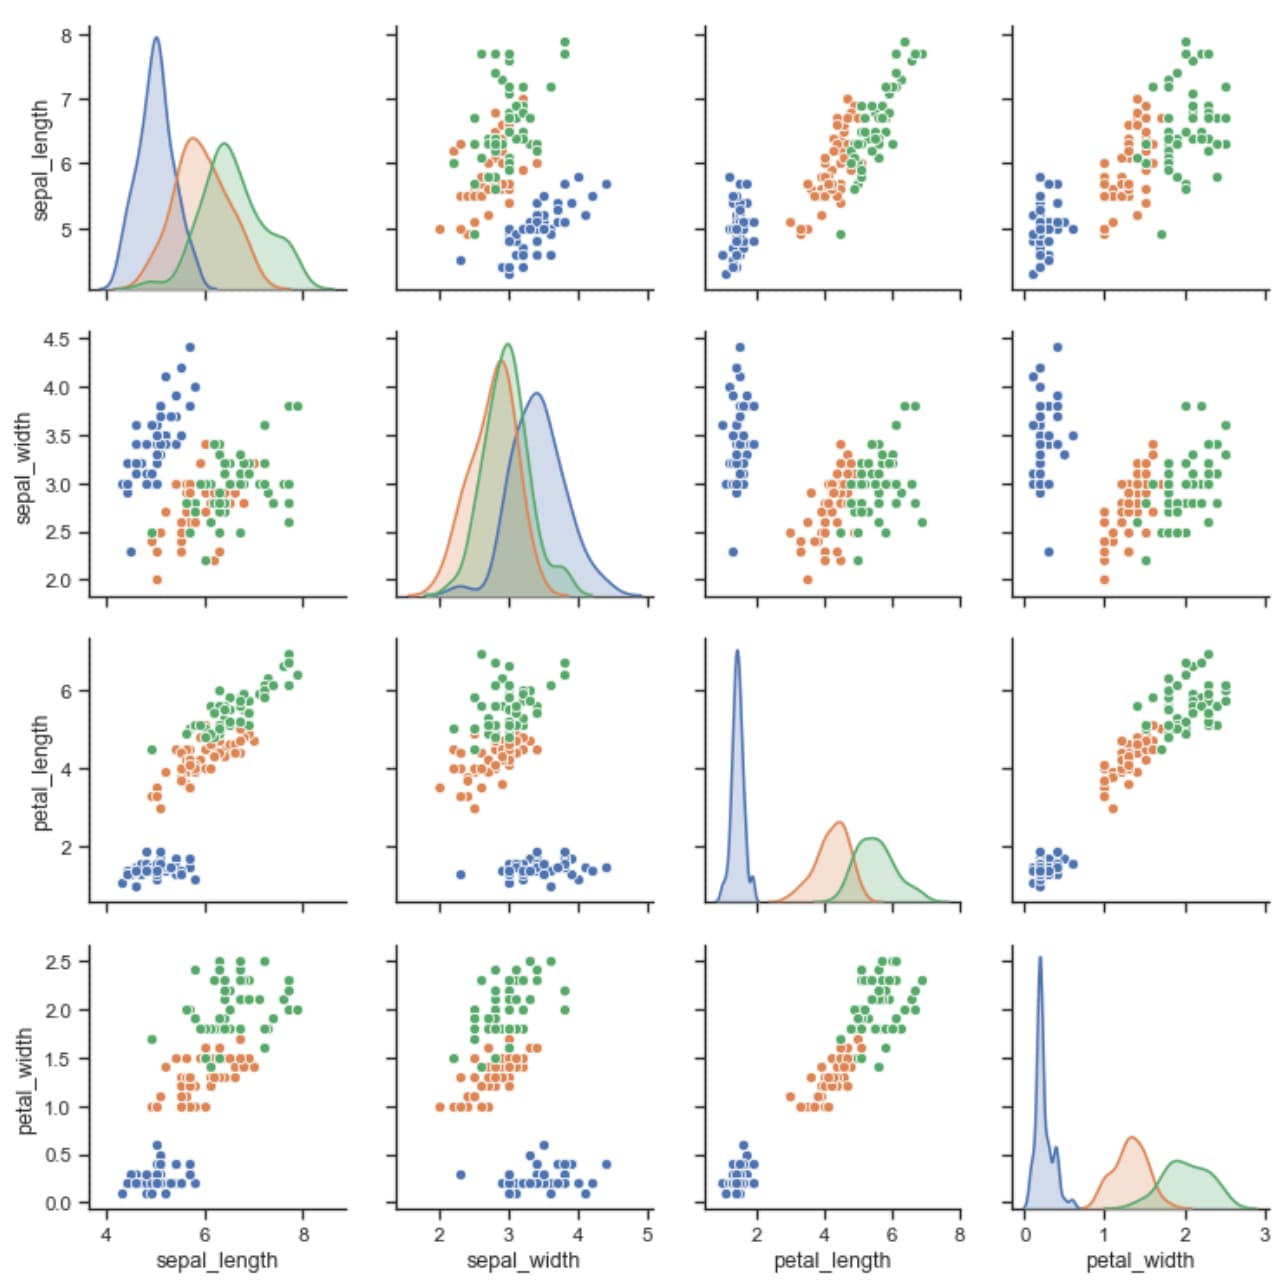
Python statistics statistical
Seaborn is a Python data visualization library based on matplotlib. It provides a high-level interface for drawing attractive and informative statistical graphics.

JavaScript/JS React financial time series
Visualization components for React [bar, line, scatter, stacked, area, pattern, heatmap, pie, radial, map, geo]
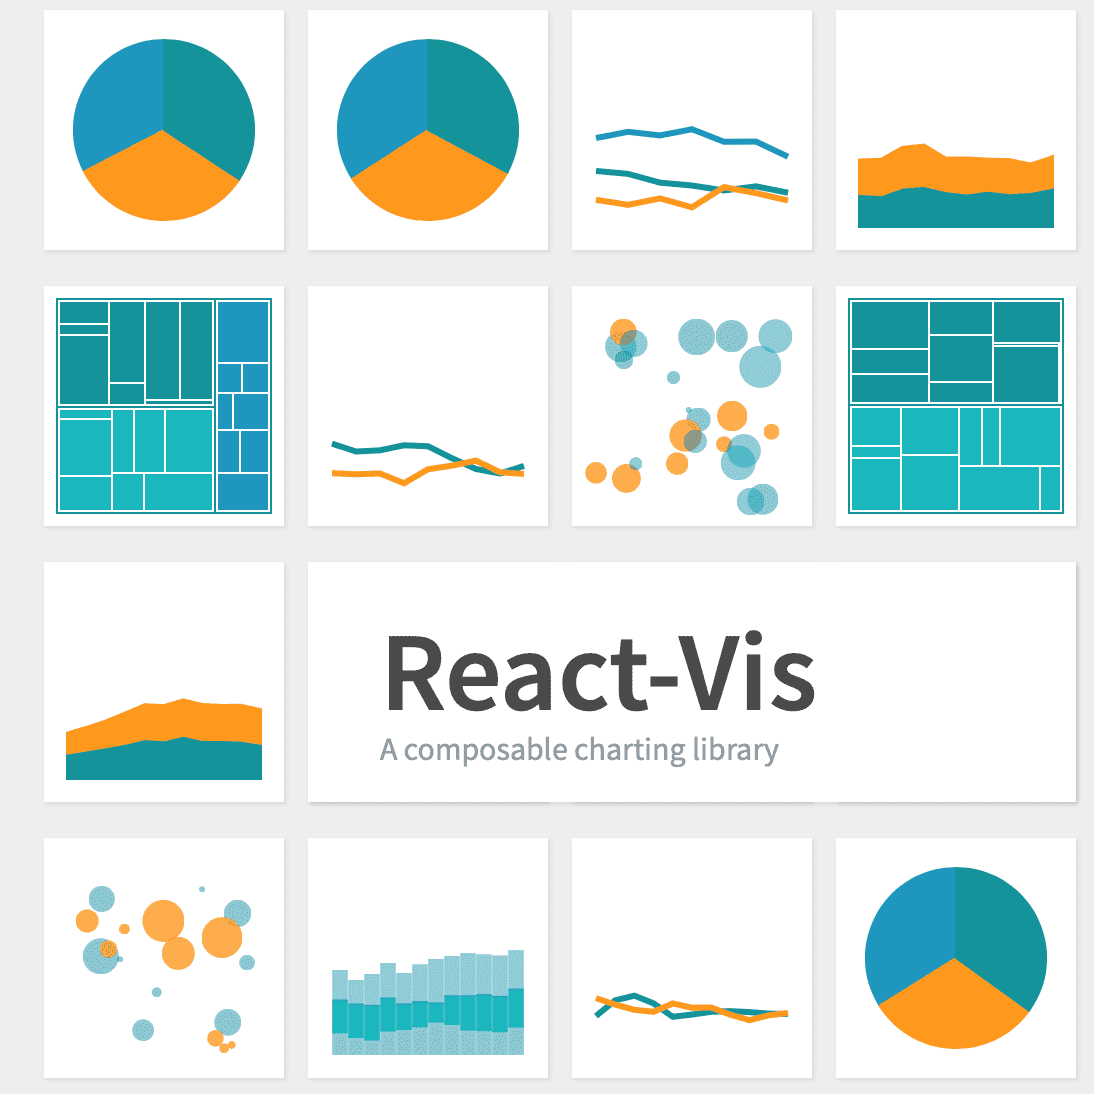
JavaScript/JS React treemaps
A collection of react components to render visualizations [area, bar, heatmap, line, scatter]

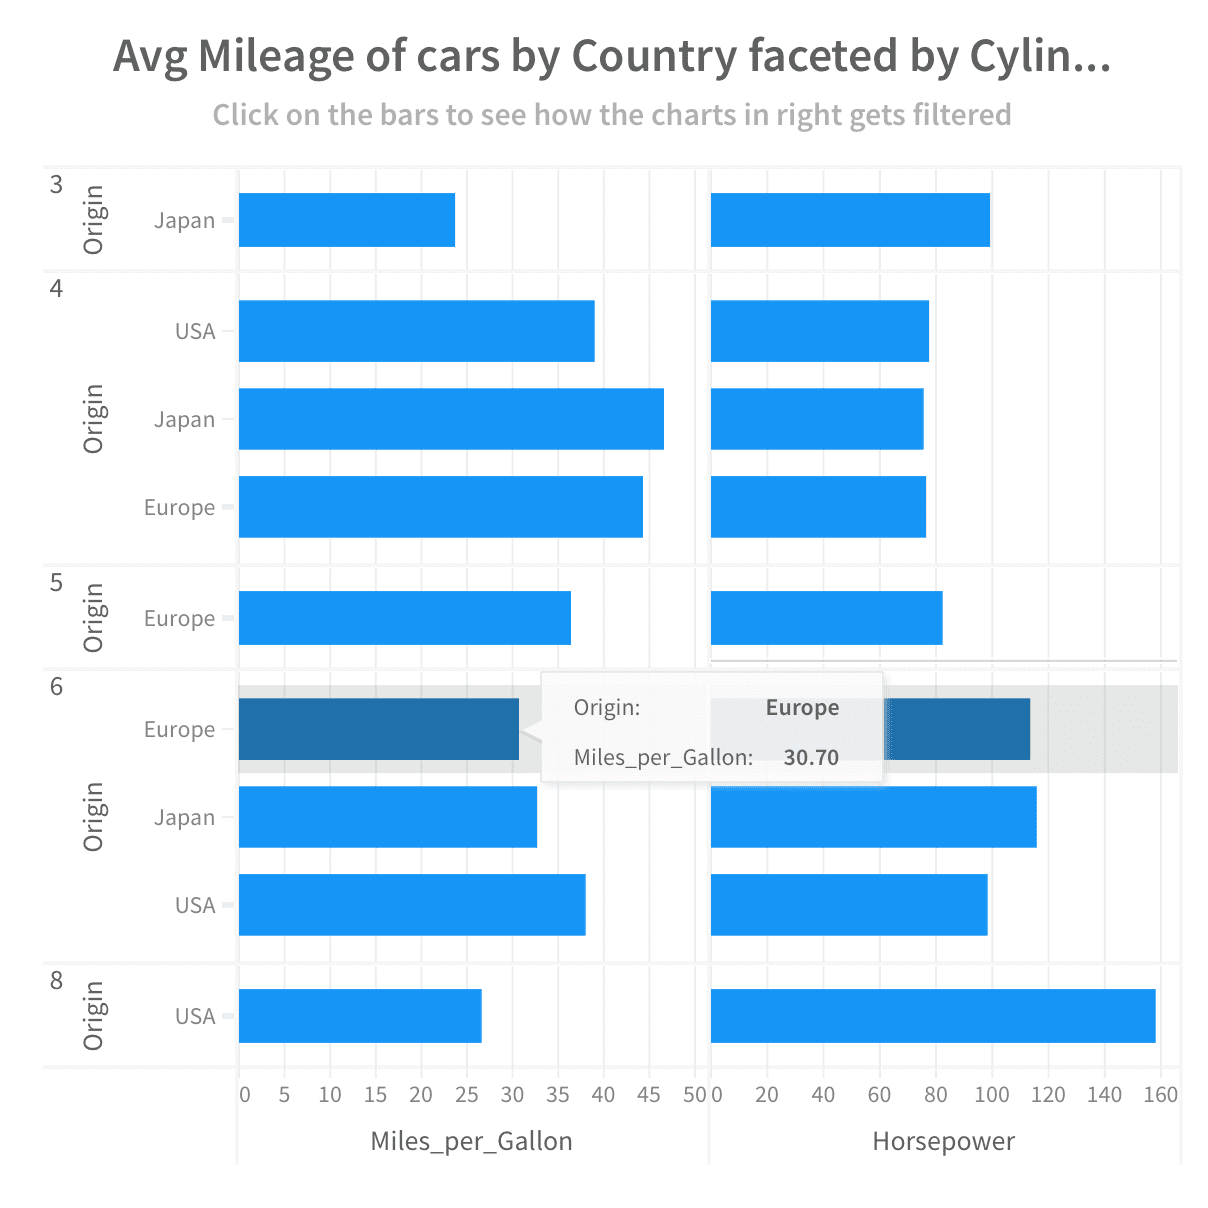
JavaScript/JS D3 financial bigdata crossfilter
dc.js is a javascript charting library with native crossfilter support, allowing highly efficient exploration on large multi-dimensional datasets (similar to crossfilter).

Python word clouds wordclouds
A compact word cloud generator built in Python; compared to other wordcloud tools, has the advantage of simplicity, filling all available space, and being able to use arbitrary masks.

JavaScript/JS React random treemaps
Dataviz components for React with isomorphic ability [bar, line, area, bubble, chord, heatmap]

JavaScript/JS OSM tilesets tilemaps transport
OpenLayers allows you to embed OpenStreetMaps tile maps on a web page. It powers thousands of geodata-rich web sites and mobile apps, and includes data about roads, trails, cafés, railway stations, etc.

JavaScript/JS D3
A popular visualization tool inspired by the work of Mike Bostock's Towards Reusable Charts, and supported by a combined effort of Novus and the NVD3 community.


Python
plotly.py is an interactive, open-source, and browser-based graphing library for Python Built on top of plotly.js, plotly.py is a high-level, declarative charting library. plotly.js ships with over 30 chart types.


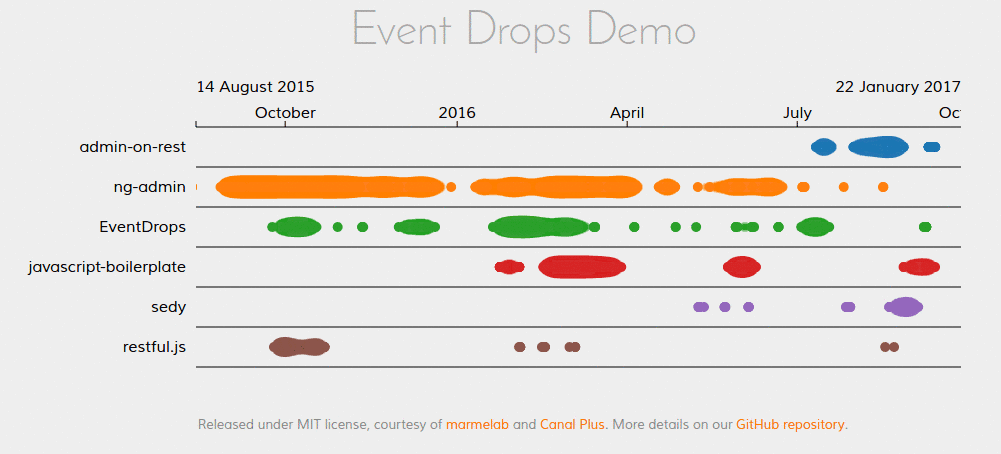
JavaScript/JS timelines
Visualize your data and events with HTML5. Create simple time sheets with JavaScript. Style them with CSS and have enable mobile view as well … Just include Timesheet.js and configure your data.

JavaScript/JS WebGL animations
Two.js is a two-dimensional drawing api geared towards modern web browsers. It is renderer agnostic enabling the same api to draw in multiple contexts: svg, canvas, and webgl.
JavaScript/JS molecular genetic bio
Cytoscape is an open source software platform for visualizing molecular interaction networks, annotated gene expression profiles, as well as other complex networks of interaction.

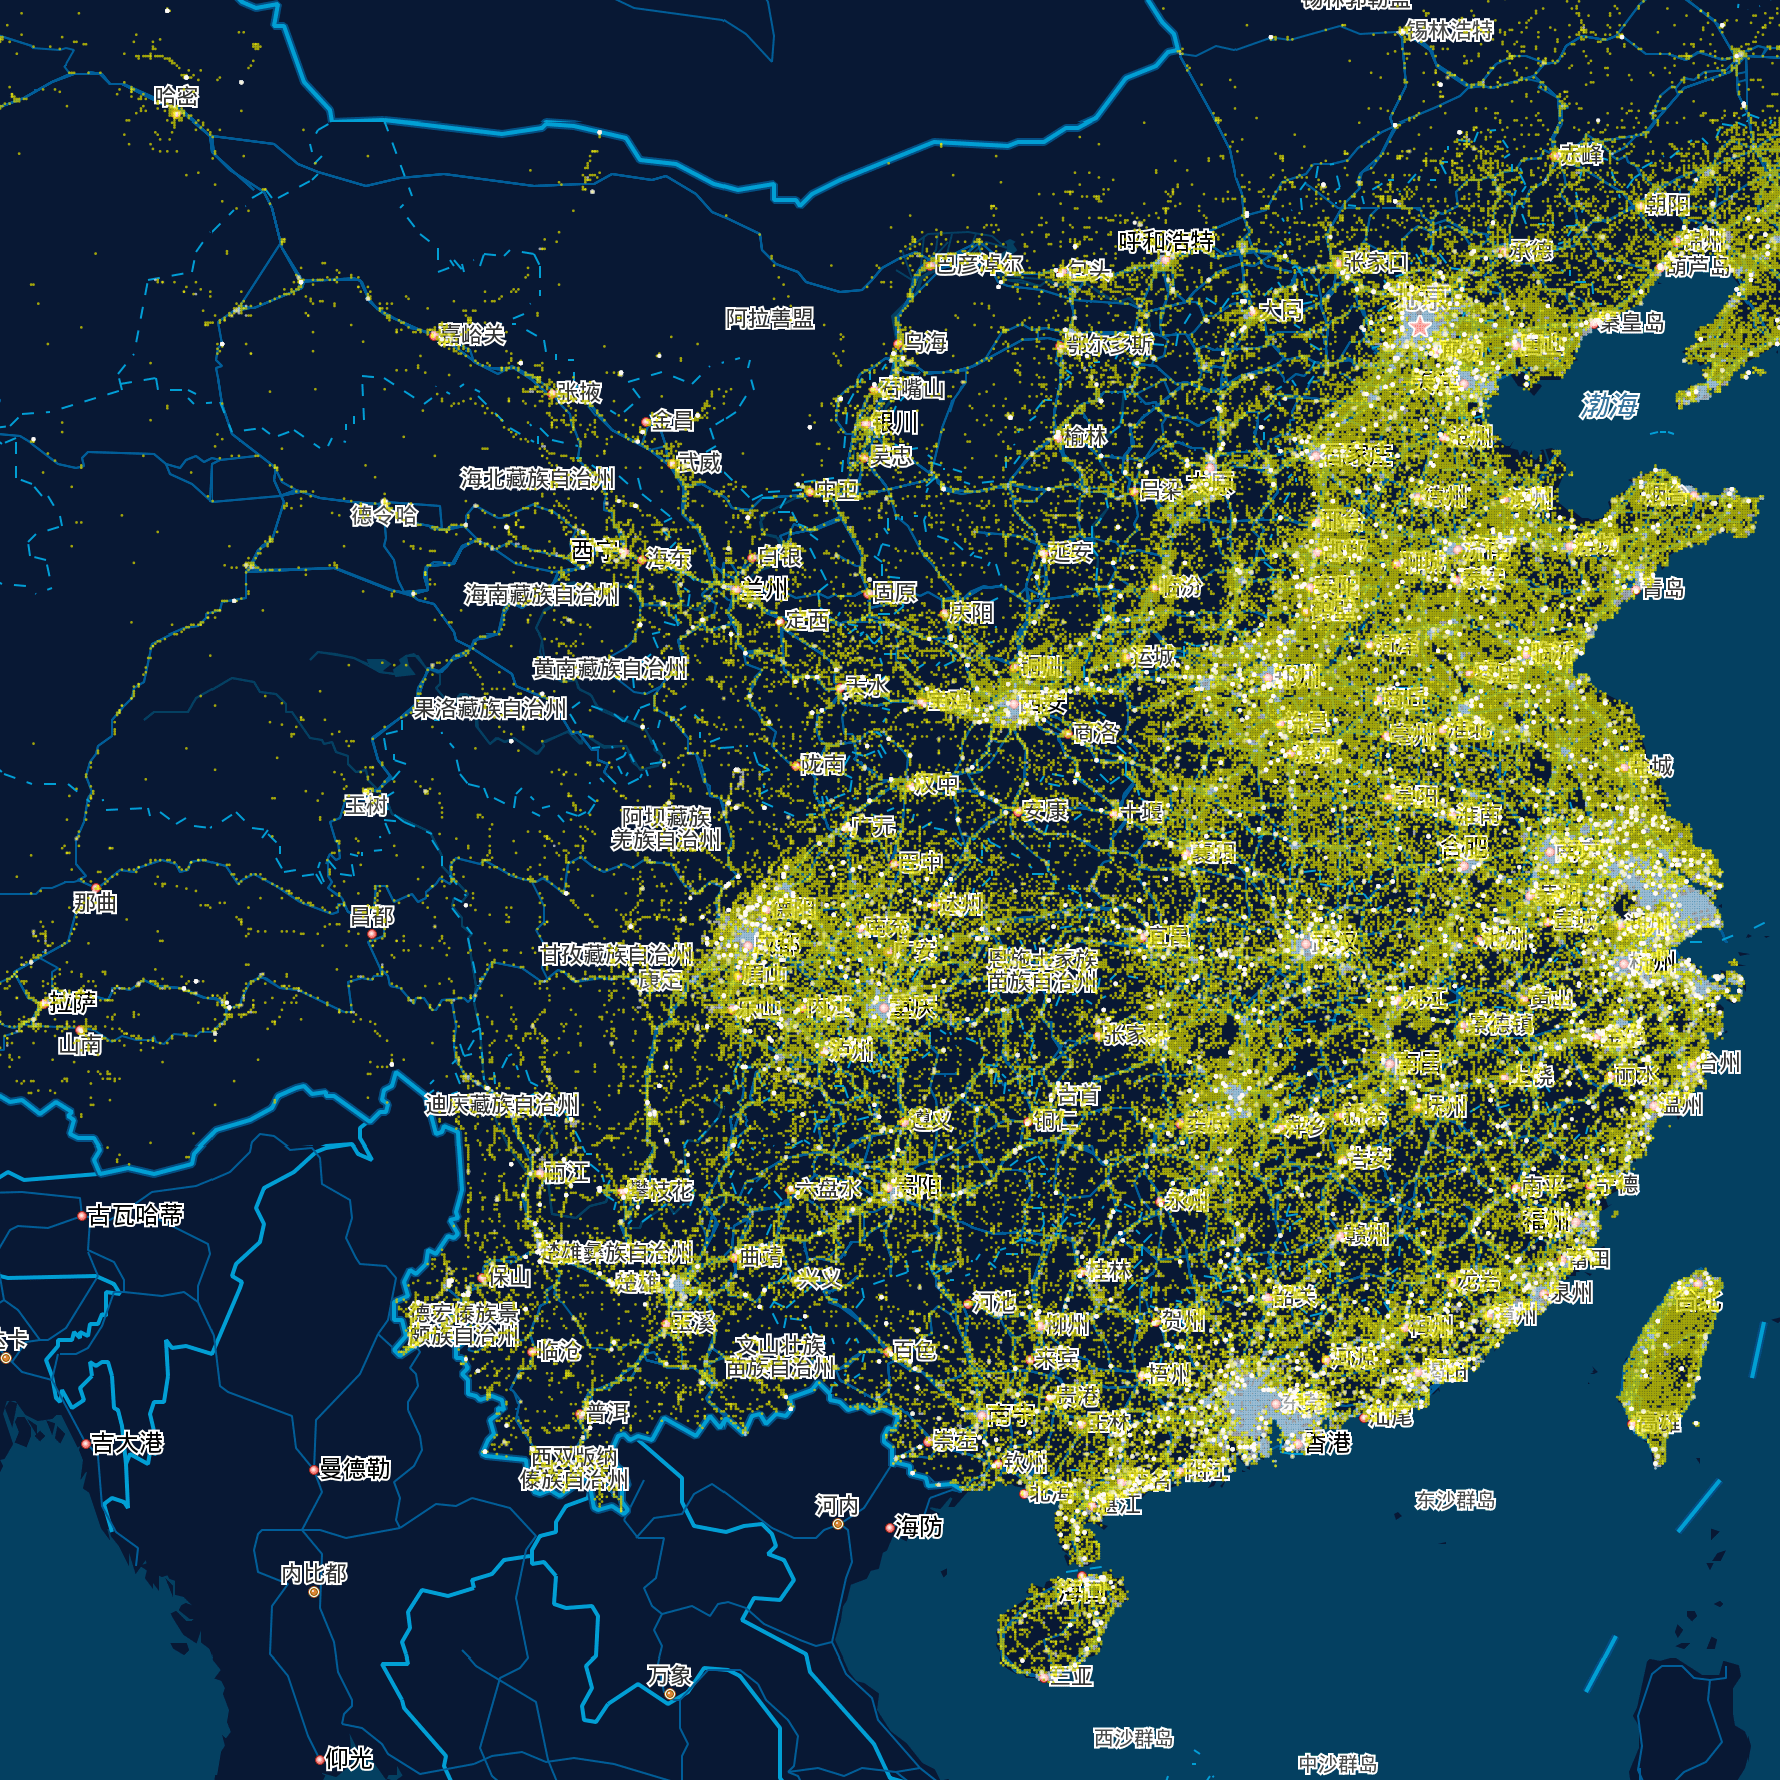
JavaScript/JS random
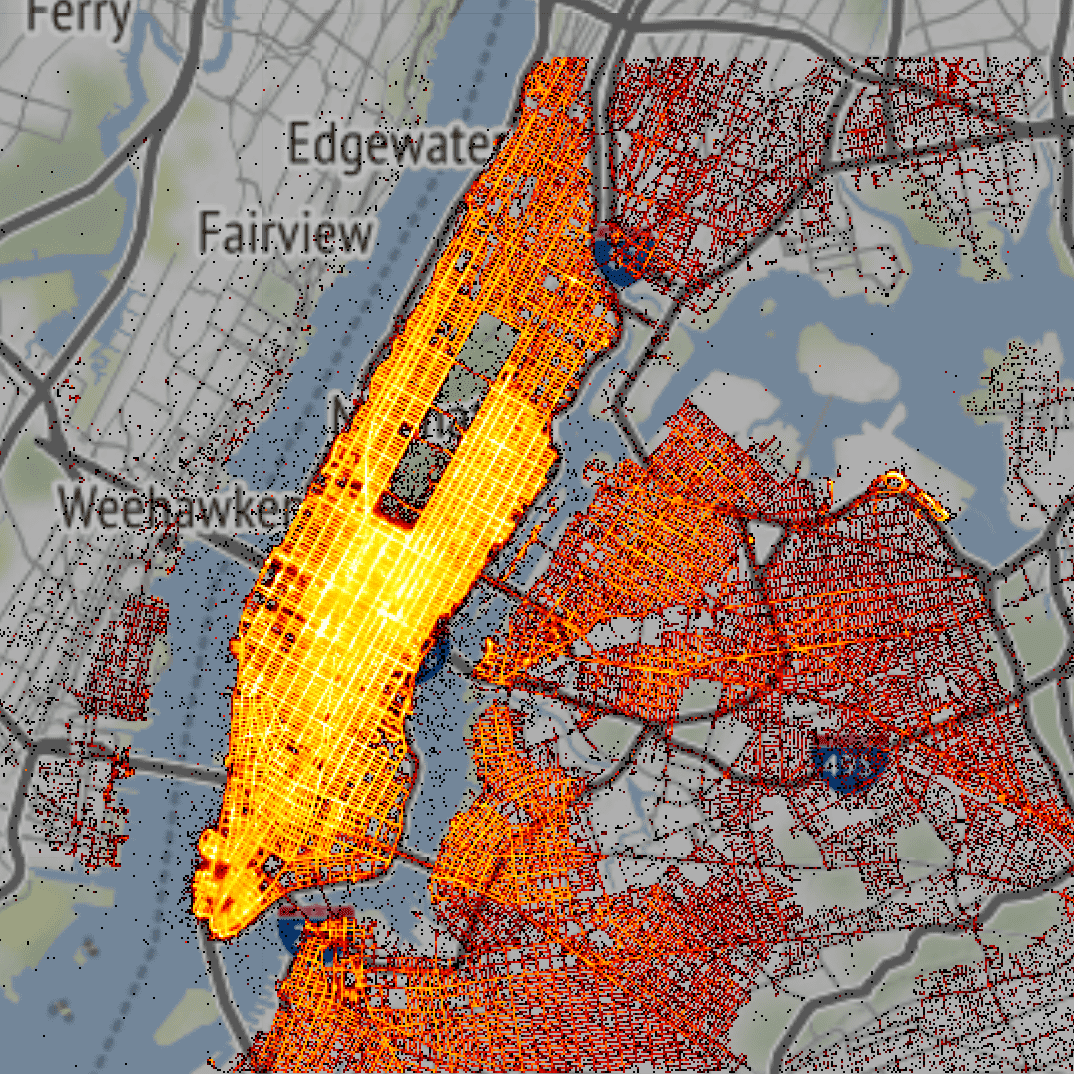
Kepler.gl is a high-performance, data-agnostic application for visual exploration of large-scale geolocation data sets. It can render millions of points representing thousands of trips and perform spatial aggregations on the fly.

JavaScript/JS frames per second (FPS) streaming
JavaScript Performance Monitor -- This class provides a simple info box that will help you monitor your code performance. FPS Frames rendered in the last second. The higher the number the better.
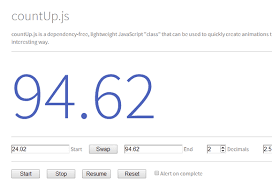
JavaScript/JS counter countdown
CountUp.js is a dependency-free, lightweight Javascript class that can be used to quickly create animations that display numerical data in a more interesting way. Despite its name, CountUp can count in either direction, depending on the start and end values that you pass.
JavaScript/JS D3 bigdata
Crossfilter is a JavaScript library for exploring large multivariate datasets in the browser. Crossfilter supports extremely fast (<30ms) interaction with coordinated views, even with datasets containing a million or more records.

Python machine learning ML neural network ANN CNN deep learning
The facets project contains two visualizations for understanding and analyzing machine learning datasets: Facets Overview and Facets Dive. The visualizations are implemented as Polymer web components, backed by Typescript code and can be easily embedded into Jupyter notebooks or webpages.
JavaScript/JS Mapbox WebGL vector tilesets tilemaps
Mapbox GL JS is a JavaScript library for interactive, customizable vector maps on the web. It takes conformant map styles, applies them to conformant vector tiles, and renders them using WebGL.
JavaScript/JS jQuery scientific time series
flot is a JavaScript plotting library for engineering and scientific applications derived from Flot: http://www.flotcharts.org/

JavaScript/JS planetarium orrery 3D exponential zoom random
CesiumJS is a JavaScript library for creating 3D globes and 2D maps in a web browser without a plugin. It uses WebGL for cross-browser hardware-accelerated graphics and is tuned for dynamic data visualization.

Java SE IoT dashboard streaming bigdata
ThingsBoard is an open-source IoT platform for data collection, processing, visualization, and device management.

JavaScript/JS source code process tracing flow diagrams documentation communications security
js2flowchart converts any JavaScript code into an SVG flowchart. Review code logic from different abstractions levels. Highlight, suppress, and refactor components visually.

Shell D3 minified terminal
sparklines for your shell. Just run spark and pass it a list of numbers (comma-delimited, spaces, whatever you'd like). It's designed to be used in conjunction with other scripts that can output in that format.

JavaScript/JS Mapbox WebGL
react-map-gl is a React-friendly components library. It provides convenient API wrappers around initializing and (to some degree) tracking the underlying map state of a Mapbox WebGL map in JavaScript.

JavaScript GeoJSON
Turf is a JavaScript library for spatial analysis. It includes traditional spatial operations, simple-to-understand helper functions for creating GeoJSON data, data classification and statistics tools.

Python minified Vega
Altair is a declarative statistical visualization library for Python, based on Vega and Vega-Lite, and the source is available on GitHub. With Altair, you can spend more time understanding your data and its meaning.

Java SE microinteractions µ presentations
GitPitch is a markdown presentation service for everyone on Git. You can use it to promote, pitch or present absolutely anything using the tools you already know and love - Markdown + Git.

JavaScript/JS streaming
Epoch is a general purpose charting library for application developers and visualization designers. It focuses on two different aspects of visualization programming: basic charts for creating historical reports, and real-time charts for displaying frequently updating time series data.

JavaScript/JS React
BizCharts is a library of charting components based on G2 and React that visualizes e-commerce business charts and visualizes the specification of e-commerce lines. Implement common and custom charts in your React project.

Objective C security documentation
KeyCastr, an open-source keystroke visualizer. In order to work, KeyCastr must be included in the list of applications with Accessibility API access, under the Security & Privacy system preferences.

TypeScript
nteract is first and foremost a dynamic tool to give you flexibility when writing code, exploring data, and authoring text to share insights about the data.

JavaScript/JS D3 time series
Cubism.js is a D3 plugin for visualizing time series. Use Cubism to construct better realtime dashboards, pulling data from Graphite, Cube and other sources. Cubism is available under the Apache License on GitHub.

JavaScript/JS D3 random
Textures.js is a javascript library for creating SVG patterns, including lines, circles, paths, cross-hatching, and custom patterns. Built on top of D3.js, it is designed for geovisualization.
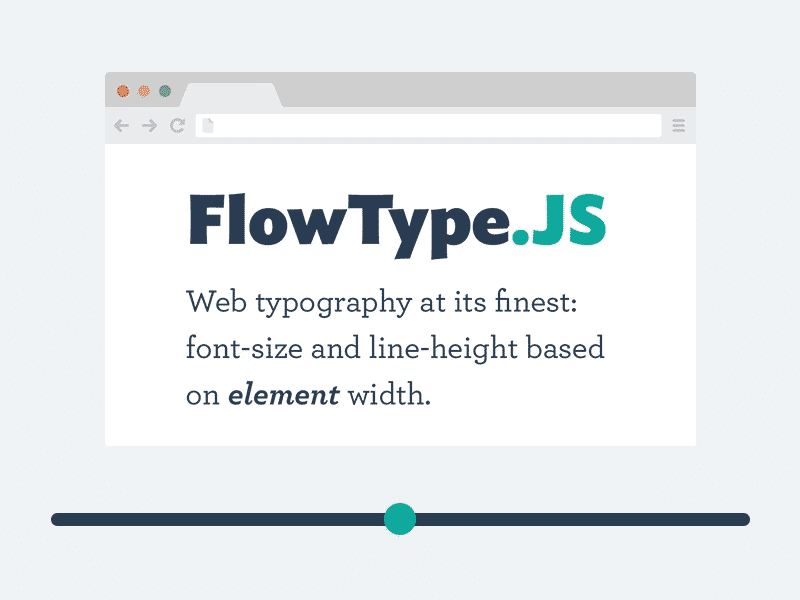
JavaScript/JS typography microinteractions µ
Ideally, the most legible typography contains 45 to 75 characters per line. FlowType eases this by changing the font-size and subsequently the line-height based on an element's width.

JavaScript/JS presentations minified microinteractions µ
Bespoke.js is a super minimal (1KB min'd and gzipped), modular presentation library for modern browsers, designed to foster a rich plugin ecosystem.

CSS annotate annotations D3 microinteractions µ
Balloon.css lets you add tooltips to page elements without any JavaScript and in just a few lines of CSS; includes special characters, emojis, and Font Awesome Icons; maintained in SASS and LESS.
JavaScript/JS microinteractions µ presentations
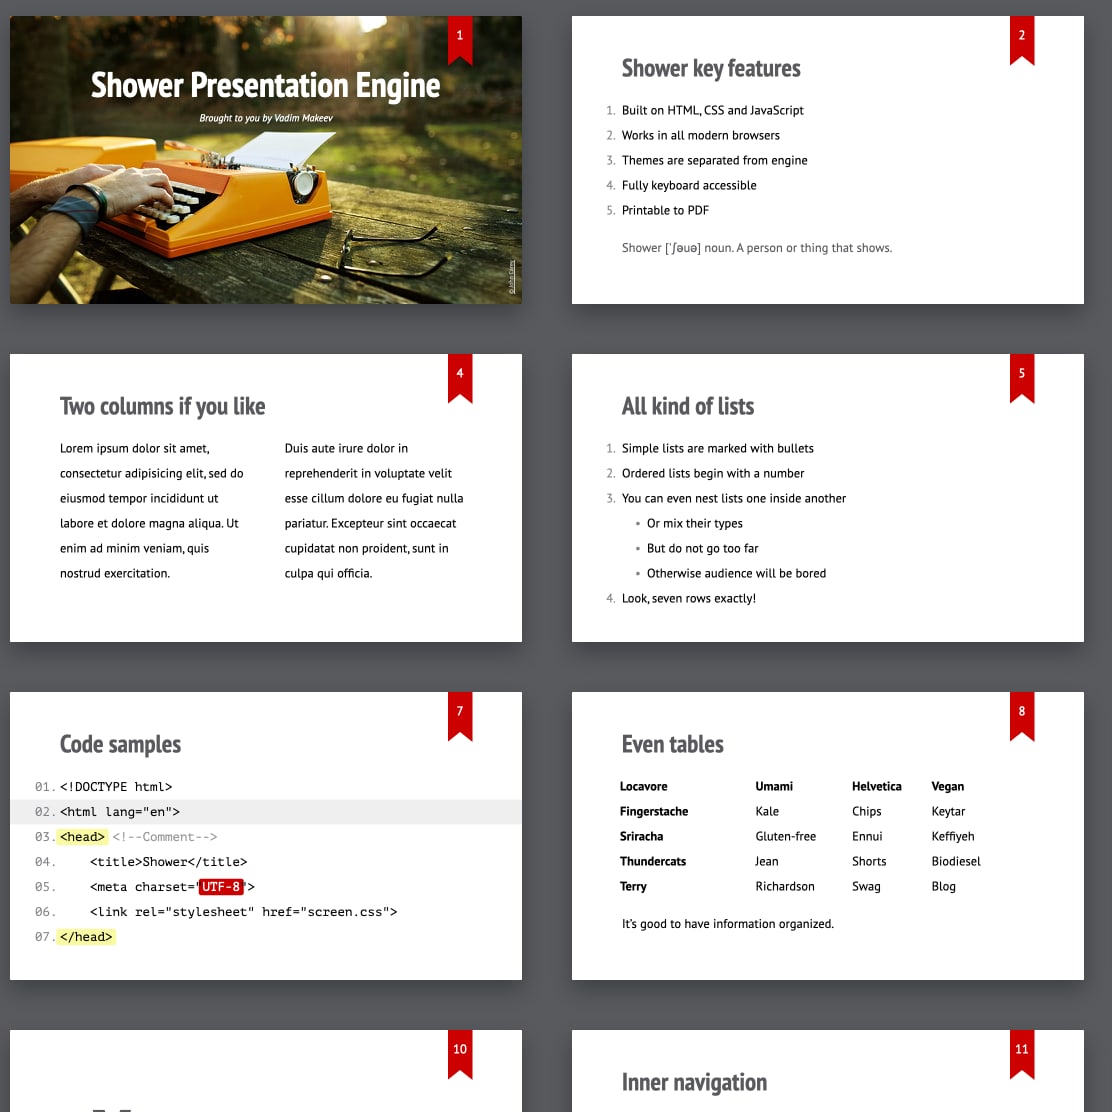
HTML presentation engine. Built on HTML, CSS and vanilla JavaScript. Works in all modern browsers. Themes are separated from engine. Fully keyboard accessible. Printable to PDF.

Python TensorFlow machine learning ML neural network ANN CNN deep learning
TensorBoard is a suite of web applications for inspecting and understanding your TensorFlow runs and graphs.

Python
Folium builds on the data wrangling strengths of the Python ecosystem and the mapping strengths of the Leaflet.js library. Manipulate your data in Python, then visualize it in a Leaflet map via folium.
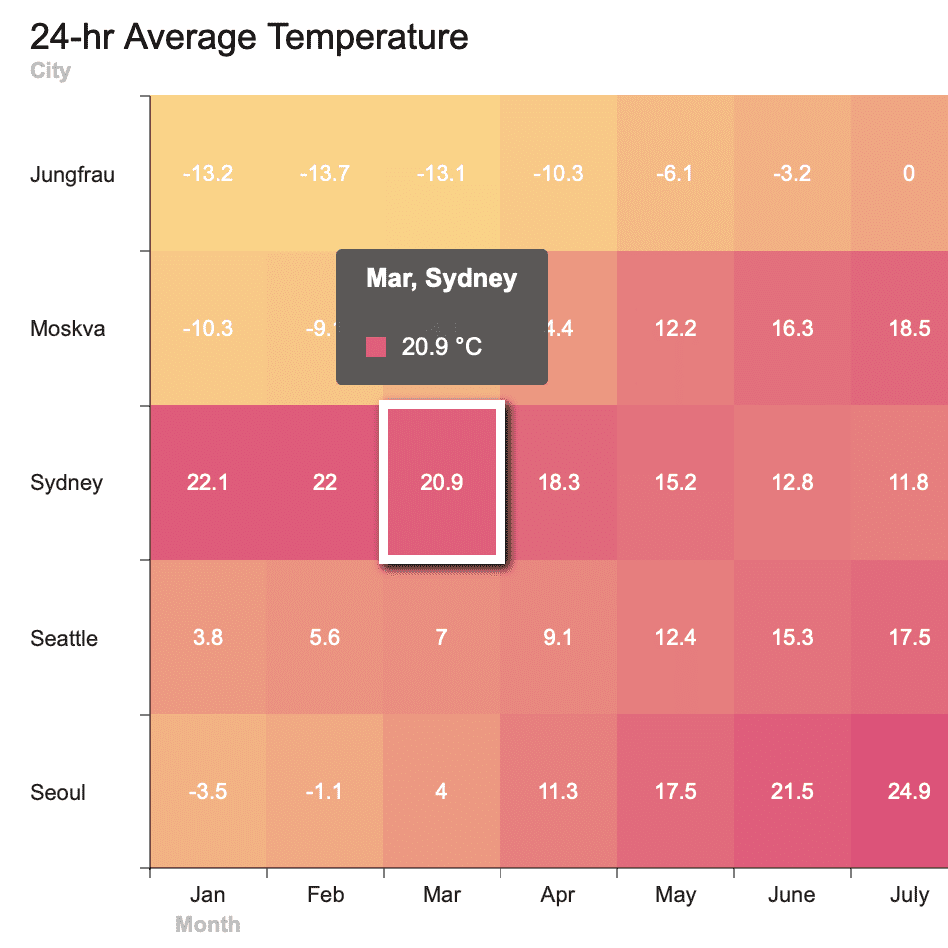
JavaScript/JS heatmaps
TOAST UI Chart supports an easy way to draw various and essential charts on your web service.
JavaScript/JS jQuery pie sparklines
Peity (sounds like deity) is a jQuery plugin that converts an element's content into a mini SVG pie, donut, line or bar chart.

Objective-C
Introducing JBChartView - Jawbone's iOS-based charting library for both line and bar graphs. It is easy to set-up, and highly customizable.
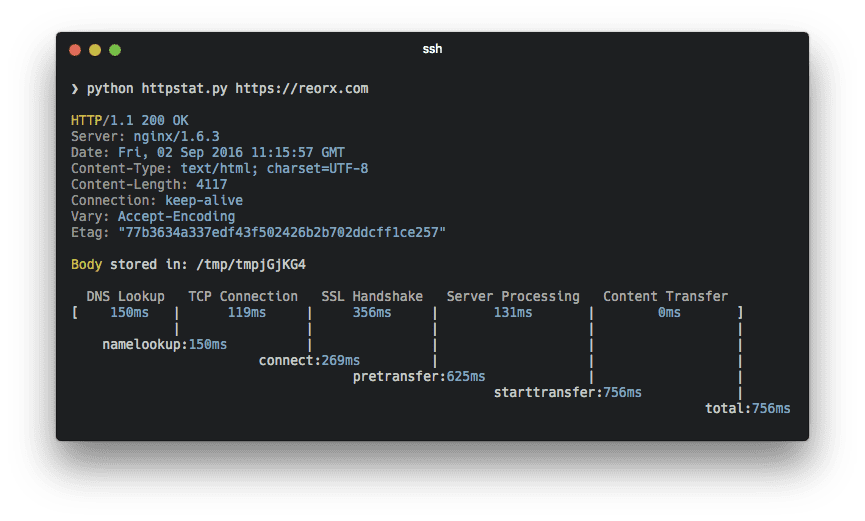
Python Shell curl terminal minifieds
httpstat visualizes curl(1) statistics in a way of beauty and clarity. It is a single file Python script that has no dependency and is compatible with Python 3.
JavaScript/JS annotate annotations typography microinteractions µ
Labella places labels on a timeline without overlap using quadratric programming; allows designers to establish preferred positions for each label, using <canvas>, SVG or any library to draw the labels.

JavaScript/JS D3 easy
Britecharts is a client-side reusable Charting Library based on D3.js v5 that offers easy and intuitive use of charts and components that can be composed together to create amazing visualizations.

JavaScript/JS D3
Re-usable JavaScript chart library, based on D3 v4+ for bar, line, area, donut, pie, step, spline charts
Java SE
Gephi is a tool for analysts and data scientists keen to explore and understand graphs. Like Photoshop™ but for graph data, Gephi is designed to reveal hidden patterns in the data.

Python
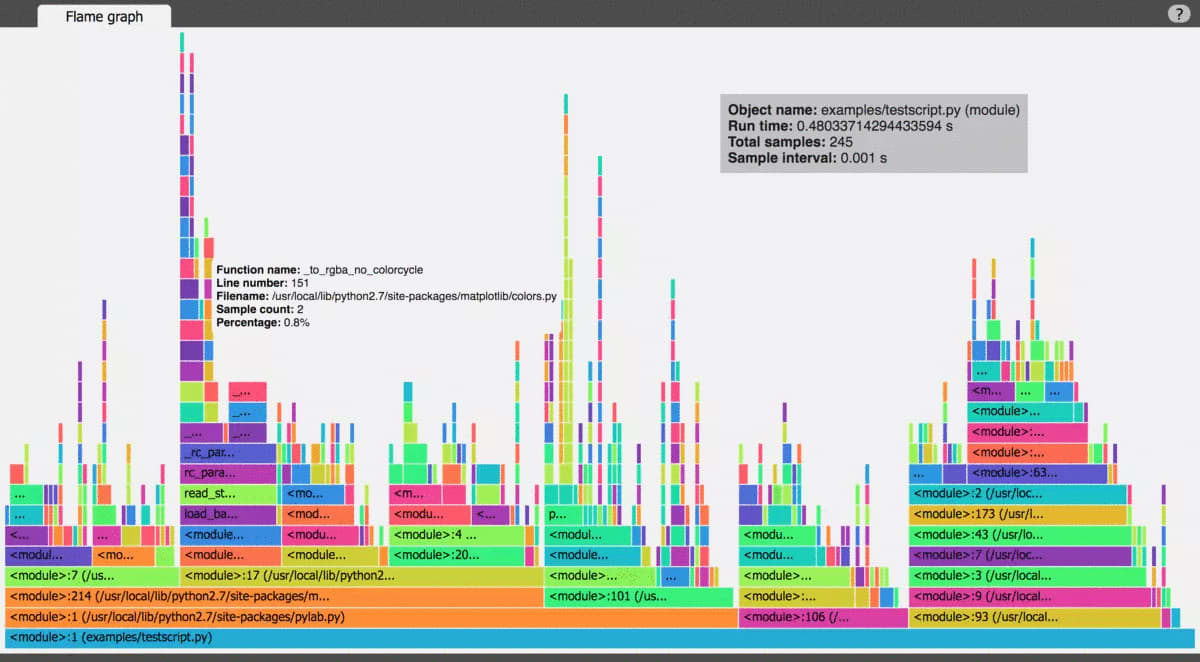
vprof is a Python package providing rich and interactive visualizations for various Python program characteristics such as running time and memory usage.
Python ML machine learning ML neural network ANN CNN deep learning
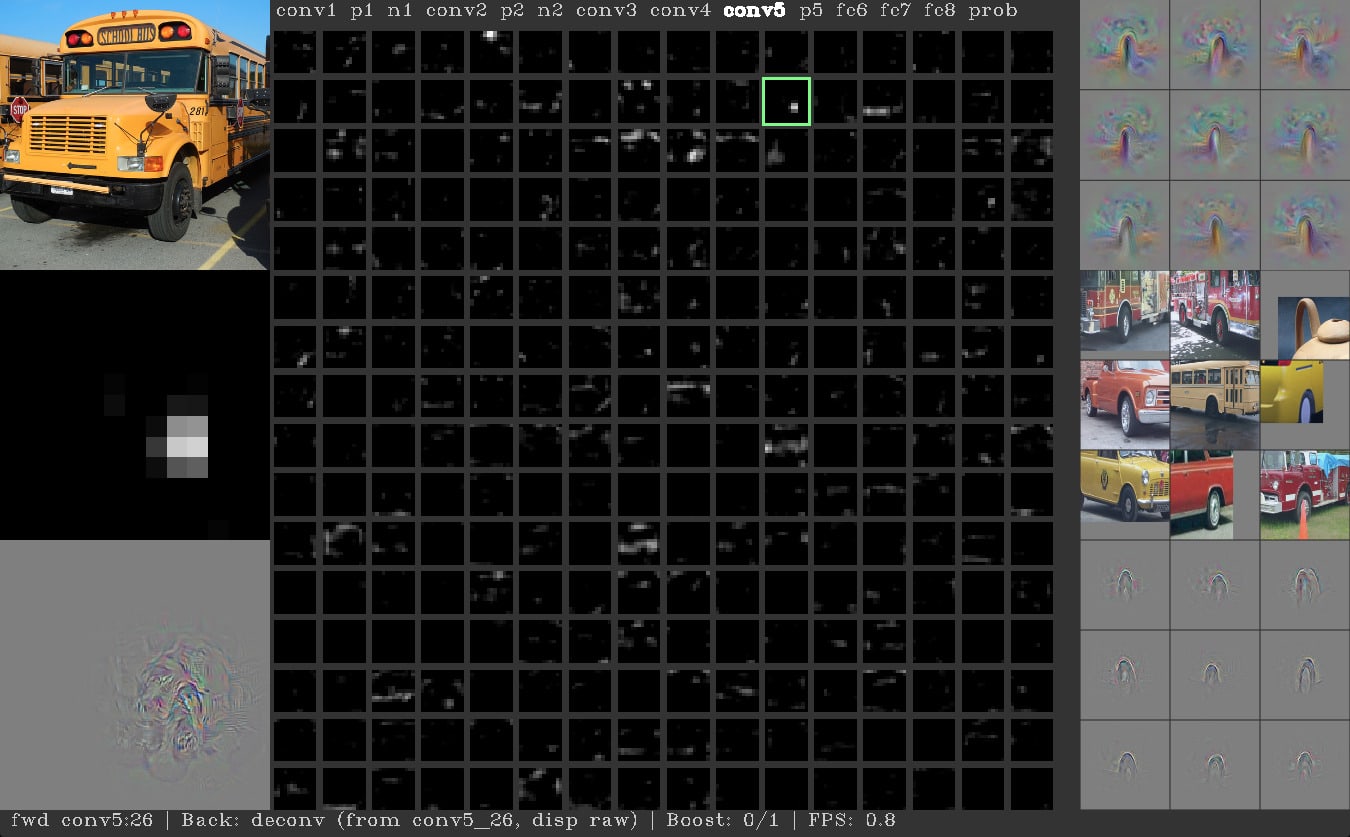
This is the code required to run the Deep Visualization Toolbox, as well as to generate the neuron-by-neuron visualizations using regularized optimization

JavaScript/JS
This project builds Graphviz with Emscripten and provides a simple wrapper for using it in the browser.

C GL
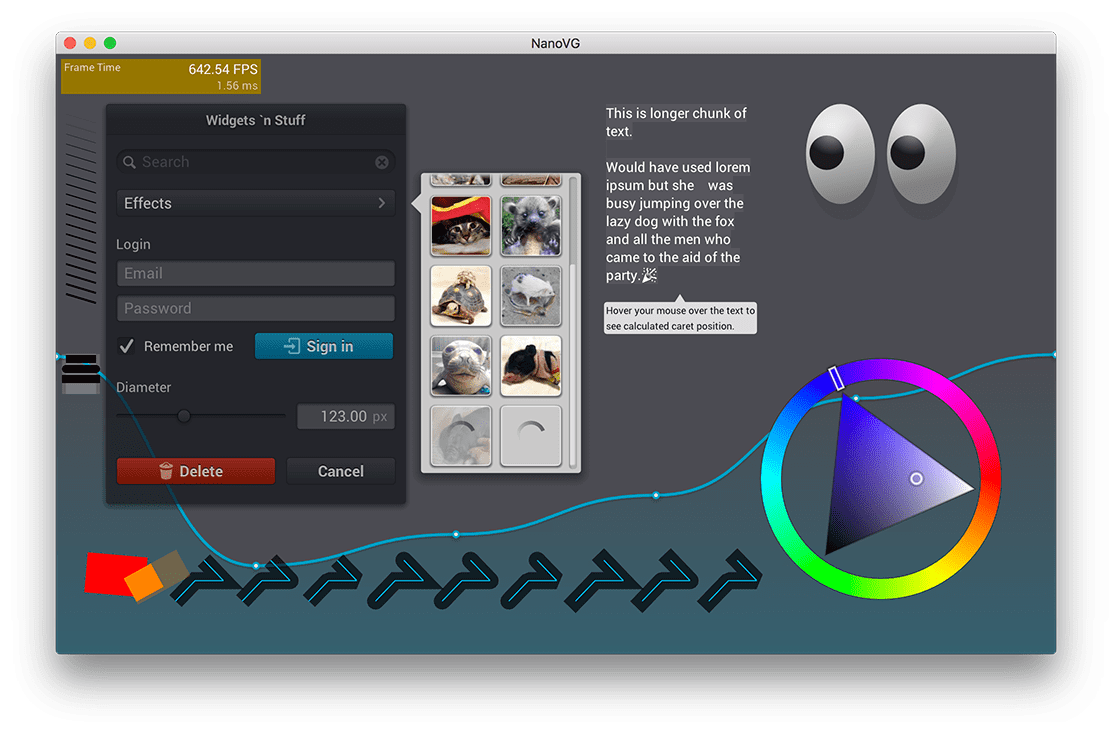
NanoVG is small antialiased vector graphics rendering library for OpenGL. It has lean API modeled after HTML5 canvas API. It is aimed to be a practical and fun toolset for building scalable user interfaces and visualizations.

C++ raster vector
QGIS is a free open source, cross-platform (lin/win/mac) geographical information system. It supports a number of raster, vector, and mesh data formats, with new support easily added using the plugin architecture.

Go protocol serialization dot
Built for serialized structured data, Pprof reads a collection of profiling samples in profile.proto format and generates textual and graphical reports using the dot visualization package.

Python
Easily configurable, chart dashboards from any arbitrary API endpoint. JSON config only. Ready to go.

JavaScript/JS
Charted is a tool for automatically visualizing data, created by the Product Science team at Medium. Give it the link to a data file and Charted returns a beautiful, shareable chart of the data.
Xcode iOS minified easy
BEMSimpleLineGraph is a charting library that makes it easy to create interactive line graphs for iOS. It is easy to set-up and to use in any iOS Project.

JavaScript/JS AngularJS
Reactive, responsive, beautiful charts for AngularJS using Chart.js

JavaScript/JS D3
Built on top of D3, Plottable gives you a set of flexible, premade components that you can combine and rearrange to build charts.

JavaScript/JS quadtree random 3D
A framework for 3D geospatial visualization in the browser using a sophisticated quadtree-based grid system, physically-based lighting and materials, realistic day/night skybox, and shadows based on position of sun in sky.

JavaScript/JS Python financial
bqplot is a 2-D visualization system for Jupyter, based on the constructs of the Grammar of Graphics, where every component of a plot is an interactive widget.

JavaScript/JS JQuery
Developed by the Samizdat Drafting Co., Arbor is a graph visualization library built with web workers and jQuery. Rather than trying to be all-encompassing, it provides an efficient, force-directed layout algorithm.
JavaScript/JS React financial
Highly customizable stock charts [area, line, scatter, bubble, bar, stacked, candlestick]
JavaScript/JS microinteractions µ presentations
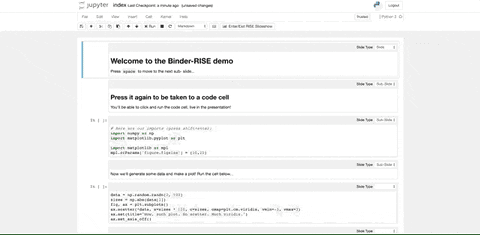
RISE allows you to instantly turn your Jupyter Notebooks into a slideshow. No out-of-band conversion is needed, switch from jupyter notebook to a live reveal.js-based slideshow in a single keystroke, and back.

Python ML XAI scikit Python machine learning bias ML neural network ANN CNN deep learning
Yellowbrick is a suite of visual diagnostic tools called “Visualizers” that extend the Scikit-Learn API to allow human steering of the model selection process.


Python machine learning ML neural network ANN CNN deep learning
VisualDL is a deep learning visualization tool that can help design deep learning jobs. It includes features such as scalar, parameter distribution, model structure and image visualization.

Java SE UML
More a rendering tool than a modeling tool, PlantUML is used to draw sequence diagrams and UML diagrams using simple, human-readable text descriptions such as Bob->Alice : hello.


Python GL
VisPy is a high-performance interactive 2D/3D data visualization library. VisPy leverages the computational power of modern Graphics Processing Units (GPUs) through the OpenGL library to display very large datasets.

Python D3 Vega time series JSON
Vincent allows you to build Vega specifications in a Pythonic way, and performs type-checking to help ensure that your specifications are correct. It also has a number of convenience chart-building methods that quickly turn Python data structures into Vega visualization grammar.

JavaScript/JS D3
Dagre is a JavaScript library that makes it easy to lay out directed graphs on the client-side. The dagre-D3 library acts as a front-end to dagre, providing actual rendering using D3.js. Includes minified option.
JavaScript/JS geometry mathematical notation curves functions mathematics random minified
Pivot chart is a an extension data visualization type of pivot table. It allows user to observe the data in different chart type without limited to table and pure numbers.

Python bio biomechanics gait analysis random small multiple
The aim of gaitutils is to provide convenient methods for extracting and plotting 3D gait analysis data. Data can be read from Vicon Nexus or directly from c3d files.
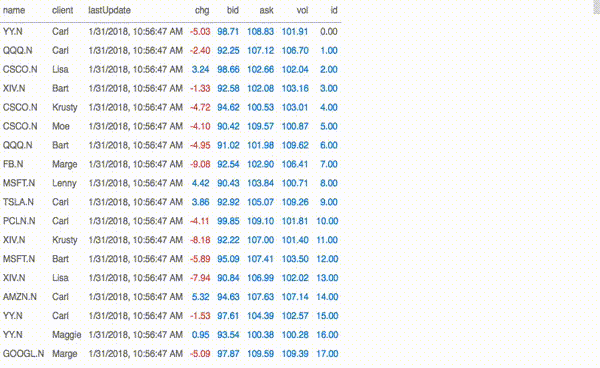
JavaScript/JS financial streaming bigdata
A streaming data visualization engine for Javascript, Perspective makes it simple to build real-time & user configurable analytics entirely in the browser.

Python
Datashader is a graphics pipeline system for representing large datasets quickly and flexibly. It allows computations to be done on intermediate representations without trial-and-error parameter tuning.


JavaScript/JS streaming time series
Smoothie Charts is a really small charting library designed for live streaming data. I built it to reduce the headaches I was getting from watching charts jerkily updating every second.

JavaScript/JS D3
A simple but powerful library for building data applications in pure Javascript and HTML. Recline re-uses best-of-breed presentation libraries like SlickGrid, Leaflet, Flot and D3 to create data 'Views' and allows you to connect them with your data in seconds.

Python
OSMnx: Python for street networks. Retrieve, model, analyze, and visualize street networks and other spatial data from OpenStreetMap. Can output to disk as shapefiles, GraphML, or SVG files.
JavaScript/JS
Mapv is a geography visualization library. It can be used to display point, polyeline, and polygon data with simple maps, heatmaps, grids, time overlays, and others to display the data. NB -- This is a prerelease of Mapv 2.0.


Python D3 statistics statistical
The mpld3 project brings together Matplotlib, the popular Python-based graphing library, and D3js, the popular JavaScript library for creating interactive data visualizations for the web.

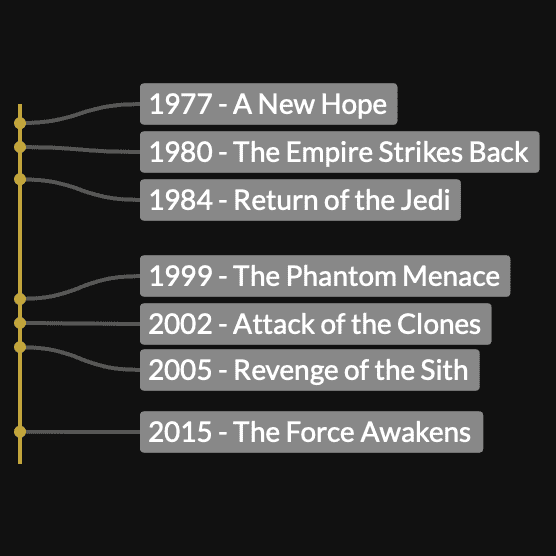
JavaScript/JS timelines
TimelineJS is an open-source tool that enables anyone to build visually rich, interactive timelines. Beginners can create a timeline using nothing more than a Google spreadsheet, like the one we used for the Timeline above. Experts can use their JSON skills to create custom installations, while keeping TimelineJS's core functionality.

JavaScript/JS conversion CSV TSV Excel JSON XML utilities
Takes CSV or tab-delimited data from Excel and converts it into several web-friendly formats, include JSON and XML.


Python minified
IPyvolume is a Python library to visualize 3d volumes and glyphs (e.g. 3d scatter plots), in the Jupyter notebook, with minimal configuration and effort.

JavaScript/JS
JSON-Splora is a GUI for editing, visualizing, and manipulating JSON data with jq or JavaScript.

Python utilities fingerprinting bias statistics statistical
provides flexible toolset of data-visualization utilities that allows quick visual summary of the completeness of your dataset, based on matplotlib.
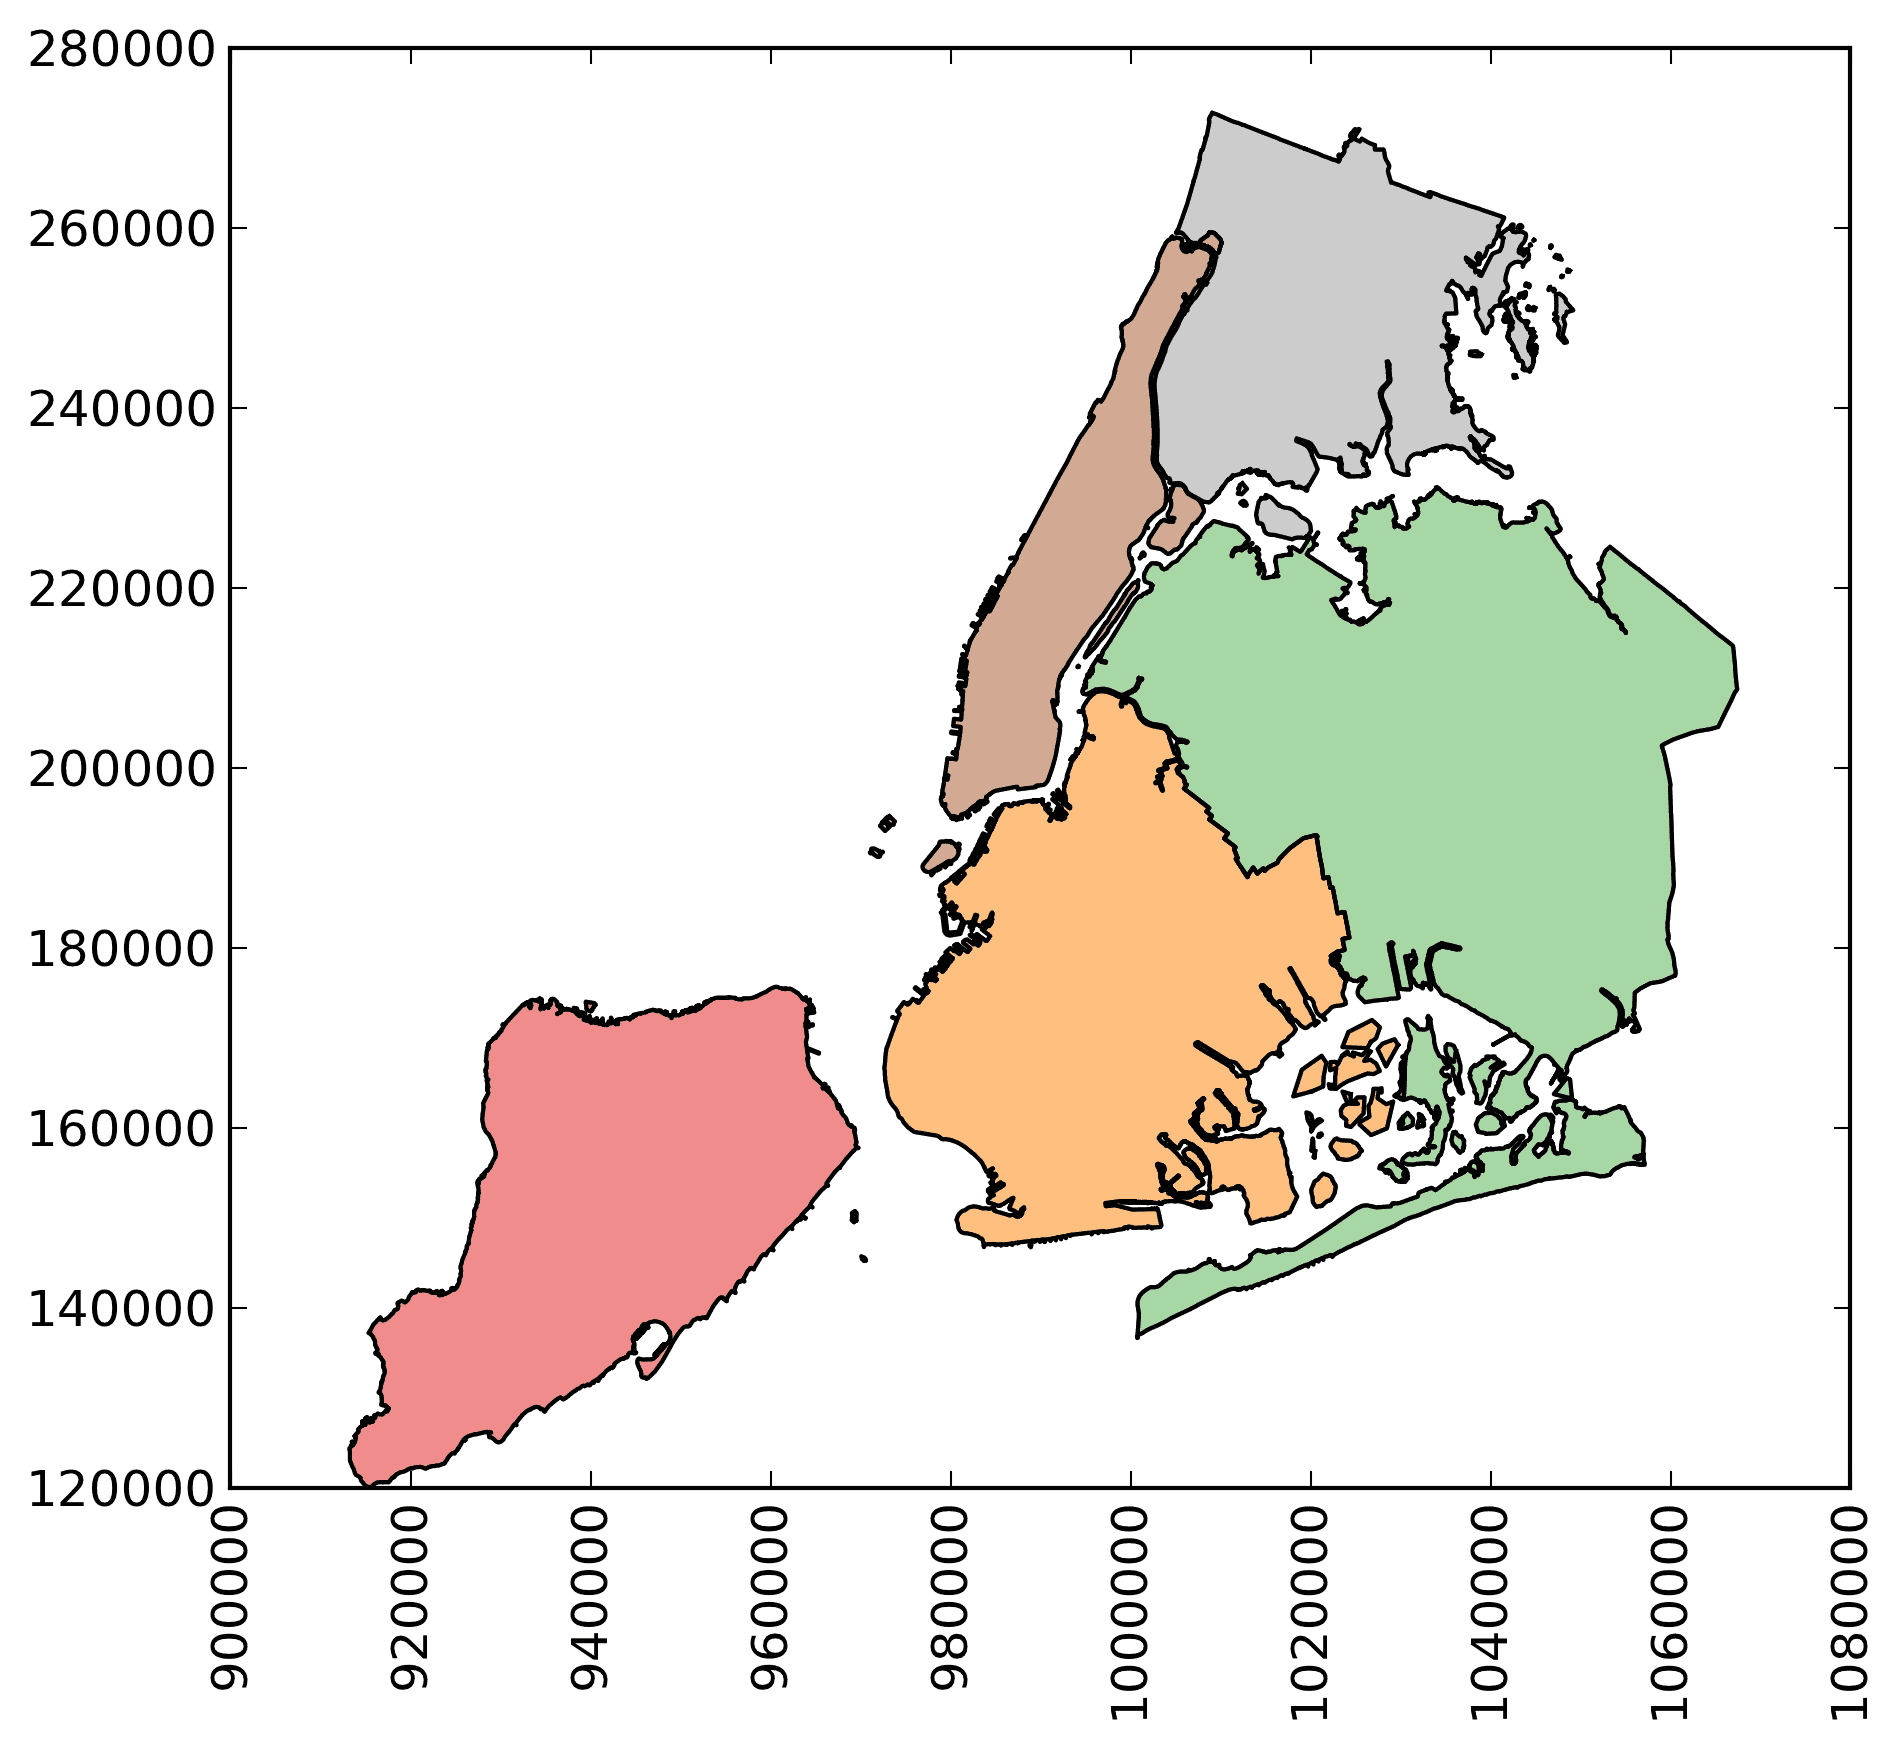
Python
GeoPandas makes working with geospatial data easier in Python. It extends the datatypes used by pandas to allow spatial operations on geometric types with shapely, fiona, descartes, and matplotlib.

Python WebGL brain neurology scientific bio
PyQtGraph is intended for use in mathematics / scientific / engineering applications. Despite being written entirely in python, the library is fast due to its heavy leverage of numpy for number crunching, Qt's GraphicsView framework for 2D display, and OpenGL for 3D display.

Haskell mathematical notation mathematics Venn sets
Create high-quality diagrams by typing mathematical notation in plain text, making it easy for non-experts to visualize challenging, high level technical concepts, including set theory.

Java SE bigdata
Tablesaw is Java for data science. It includes a dataframe and a visualization library, as well as utilities for loading, transforming, filtering, and summarizing data. It's fast and careful with memory.
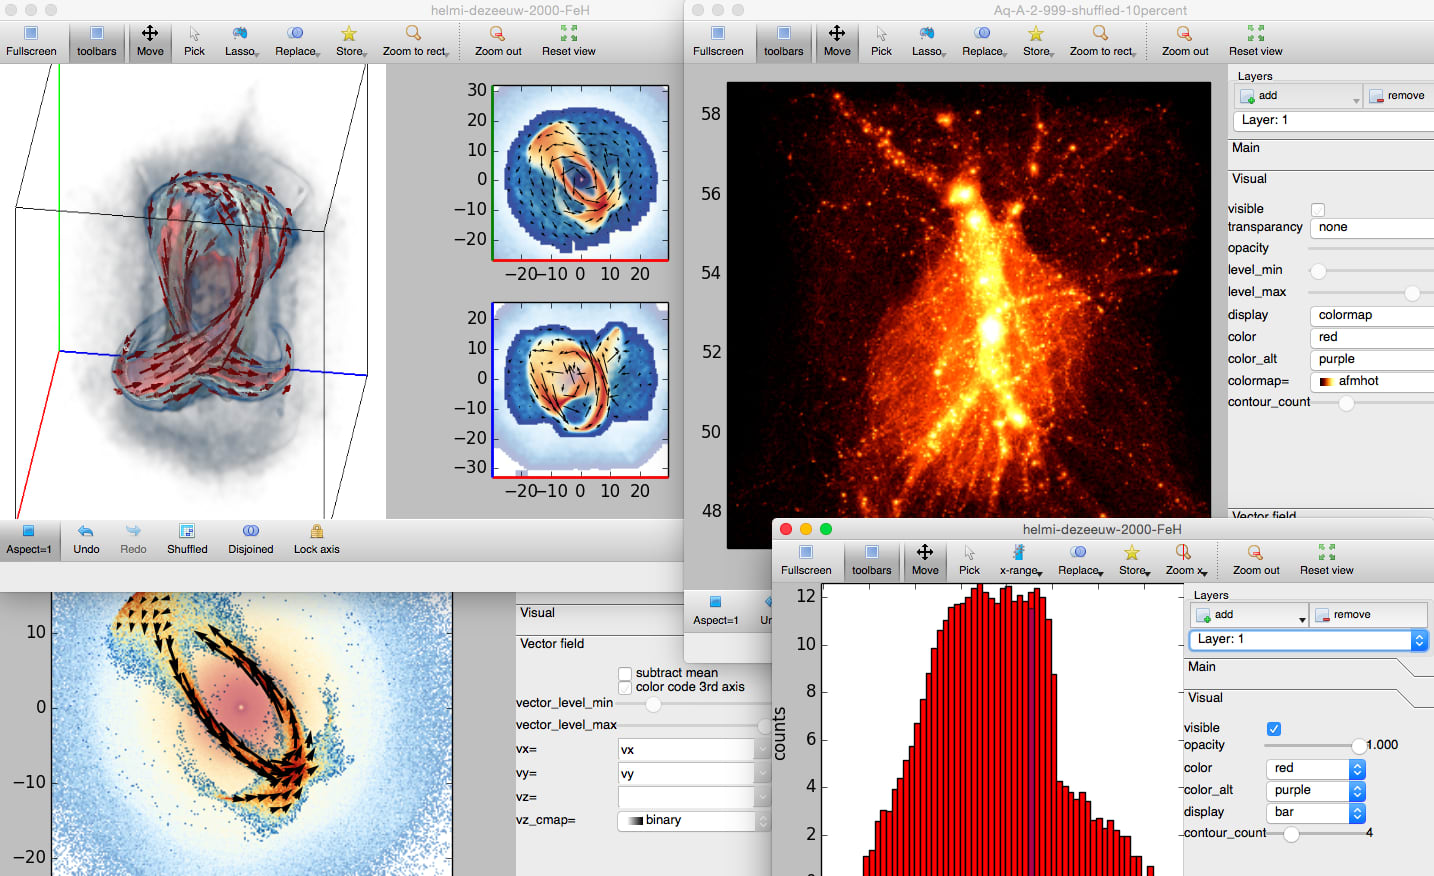
Python tabular statiscal statistics
Vaex is a python library for lazy Out-of-Core DataFrames (similar to Pandas), to visualize and explore big tabular datasets. It can calculate statistics such as mean, sum, count, standard deviation etc, on an N-dimensional grid for more than a billion (10^9) objects/rows per second.

JavaScript/JS React TopoJSON D3
A React component library that allows users to make pure React SVG maps using d3-geo and TopoJSON. Includes graticules, custom projection, custom SVG markers, zooming and panning, regional displays, and annotations.

JavaScript/JS sketch D3
roughViz.js is a reusable JavaScript library for creating sketchy/hand-drawn styled charts in the browser, based on D3v5, roughjs, and handy. Use these charts where the communication goal is to show intent or generality, and not absolute precision. Or just because they're fun and look weird.

JavaScript/JS animation
Storyboarder makes it easy to visualize a story as fast you can draw stick figures. Quickly draw to test if a story idea works. Create and show animatics to others. Express your story idea without making a movie.

JavaScript/JS D3
Envision.js is a library for creating fast, dynamic and interactive HTML5 visualizations.

R-project
An R package for creating interactive web graphics via the open source JavaScript graphing library plotly.js.

JavaScript/JS vector tilesets tilemaps
Built by SimpleGeo and Stamen, Polymaps is a free JavaScript library for making dynamic interactive maps. Supports multi-zoom data, tiled vectors, OpenStreetMap, CloudMade, Bing, and other sources.

JavaScript/JS typography microinteractions µ highlighting jQuery
A simple JavaScript keyword highlighter; dynamically mark specific search terms or custom regular expressions with options for different use-cases. Also available as jQuery plugin.

JavaScript/JS
Visualize and analyze your Webpack bundle to see which modules are taking up space and which might be duplicates. This tool is still pretty new, so please submit issues or feature requests!

Python JavaScript/JS
Created for designers and data journalists alike, Kartograph is a simple, lightweight framework for building interactive SVG map applications without Google Maps or any other mapping service.

JavaScript/JS D3 React
Let React have complete control over the DOM even when using D3. This way we can benefit from Reacts Virtual DOM.


JavaScript/JS force directed
Springy.js is a force directed graph layout algorithm. It is designed to be small and simple, generating visualizations in <canvas>, SVG, WebGL, or even just plain old positioned HTML elements.

Python machine learning ML neural network ANN CNN deep learning
An intuitive library to add plotting functionality to scikit-learn objects.

JavaScript/JS lightbox microinteractions µ
A free JavaScript image gallery framework that simplifies the process of creating beautiful image galleries for the web and mobile devices.

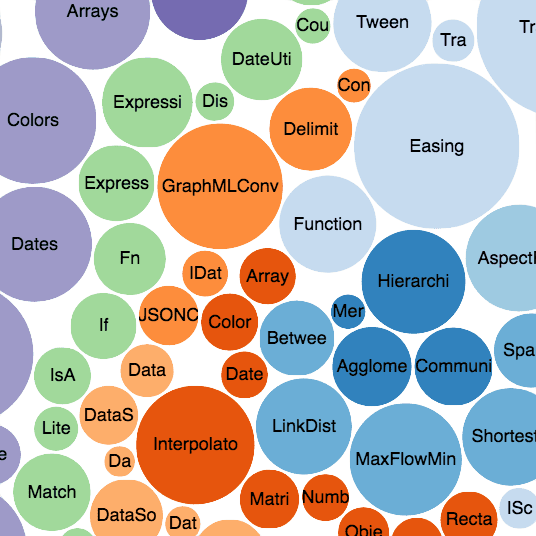
JavaScript/JS treemaps
The JavaScript InfoVis Toolkit provides tools for creating Interactive Data Visualizations for the Web.

Python
HyperTools is designed to facilitate visual explorations of high-dimensional data with a single function call that reduces the dimensionality of the dataset(s) and creates a plot.

Go Golang
Generate globe wireframe visualizations in Golang. Start off with a blank globe with a graticule at 10 degree intervals, then add some land boundaries, and center the view on a point.

JavaScript/JS
Make visualization in markdown using this markdown-it plugin. Generate customized charts with two lines of code.

Python Pytorch machine learning ML GAN bias generative adversarial interpretable XAI CV
As part of NetDissect, GANDissect inspects the internal representations of generative adversarial networks (GANs) to understand how units align with human-interpretable concepts.

JavaScript/JS WebGL GeoJSON TopoJSON vector tilesets tilemaps
Tangram is a JavaScript library for rendering 2D and 3D maps in browser with WebGL. While tuned for OpenStreetMap, it supports GeoJSON, TopoJSON, or binary vector data, including tilesets.
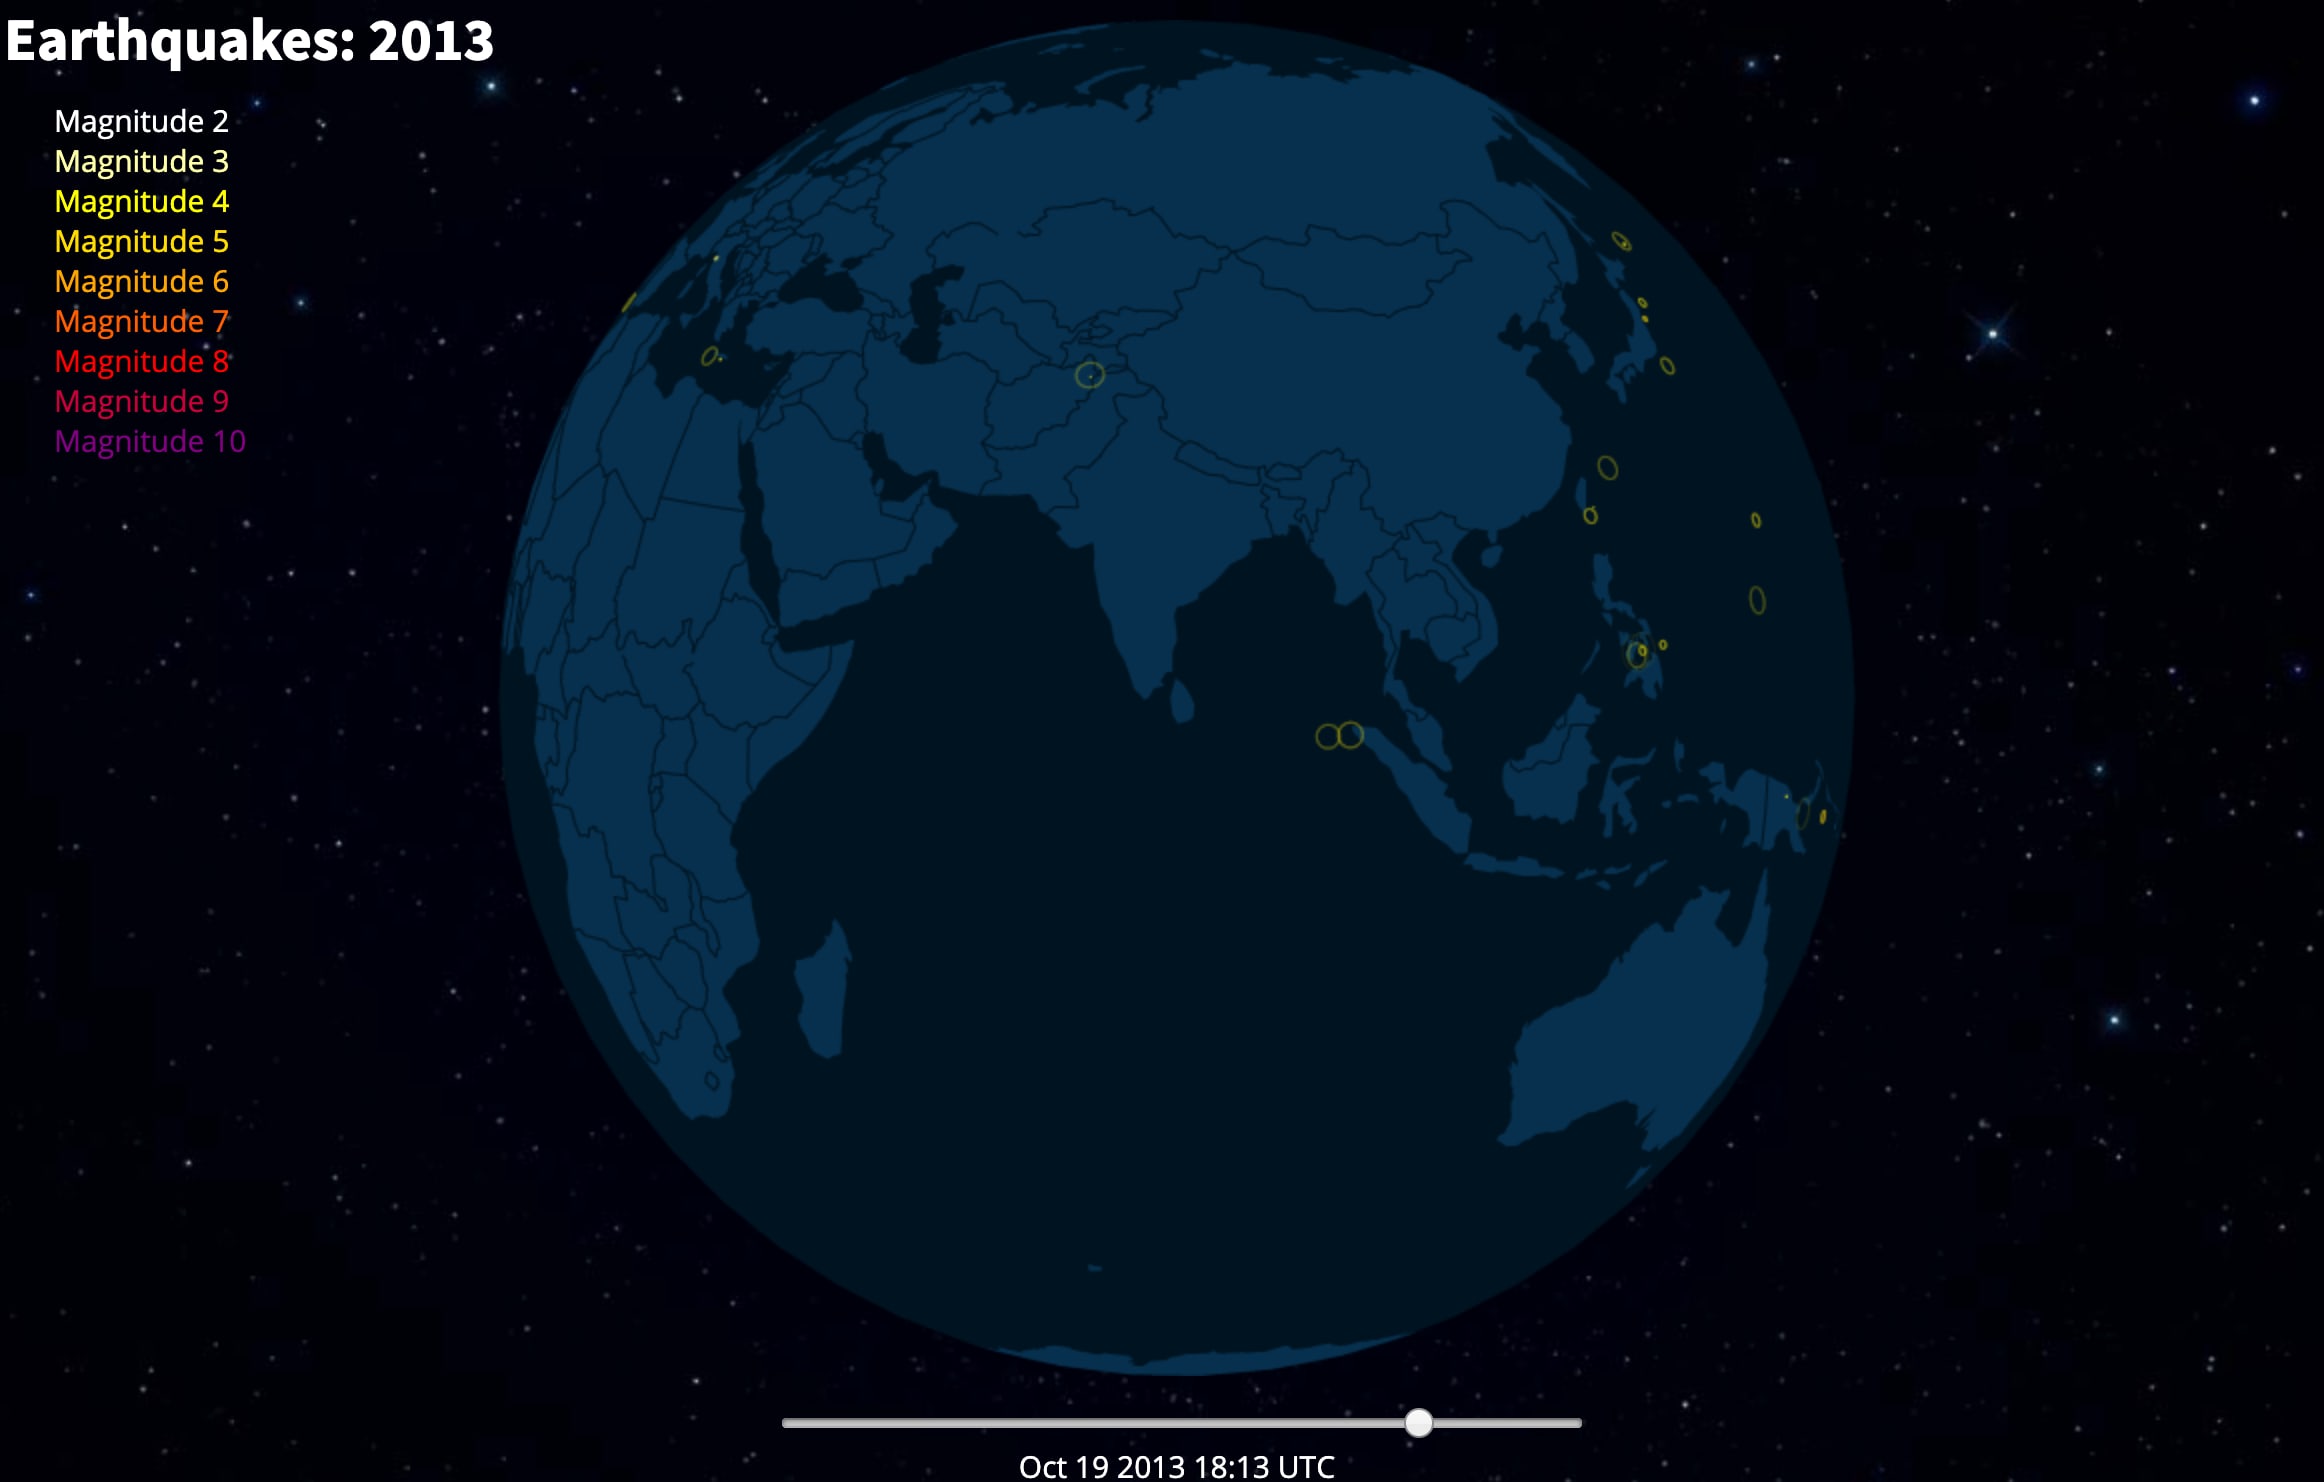
JavaScript/JS D3 TopoJSON
Planetary.js is a JavaScript library for building interactive <canvas> globes. Based on D3.js and TopoJSON, it supports zoom, rotation, mouse interaction, and animated pings at any coordinate.

JavaScript/JS D3
Cola is an open-source JavaScript library for arranging your HTML5 documents and diagrams using constraint-based optimization techniques. It is both D3.js and Cytoscape compatible.

JavaScript/JS dashboards React
Dazzle is a library for building dashboards with React JS. Dazzle does not depend on any front-end libraries but it makes it easier to integrate with them. Dazzle's goal is to be flexible and simple. Even though there are some UI components readily available out of the box, you have the complete control to override them as you wish with your own styles and layout.


JavaScript/JS
A simple web-based 3D layer visualizer (useful for visualizing material UIs and other things involving depth/shadows)


C++ raster vector
GDAL is an open source X/MIT licensed raster and vector geospatial data format translator. It supports a wide variety of formats and includes several useful command line utilities for data processing.
Python
HoloViews is an open-source Python library designed to make data analysis and visualization seamless and simple. With HoloViews, you can usually express what you want to do in very few lines of code, letting you focus on what you are trying to explore and convey, not on the process of plotting.

JavaScript/JS software version control source code treemaps
JSCity represents a JavaScript program as a city; folders are districts and files are sub-districts; the buildings are functions; inner functions are represented as buildings on the top of their nested function/building.

C++ GeoJSON Geobuf Mapbox vector tilesets tilemaps
Backed by MapBox, tippecanoe builds vector tilesets from collections of GeoJSON, Geobuf, or CSV features. Merge multiple sources, handle low zoom levels, and selectively remove and replace features from tilesets.

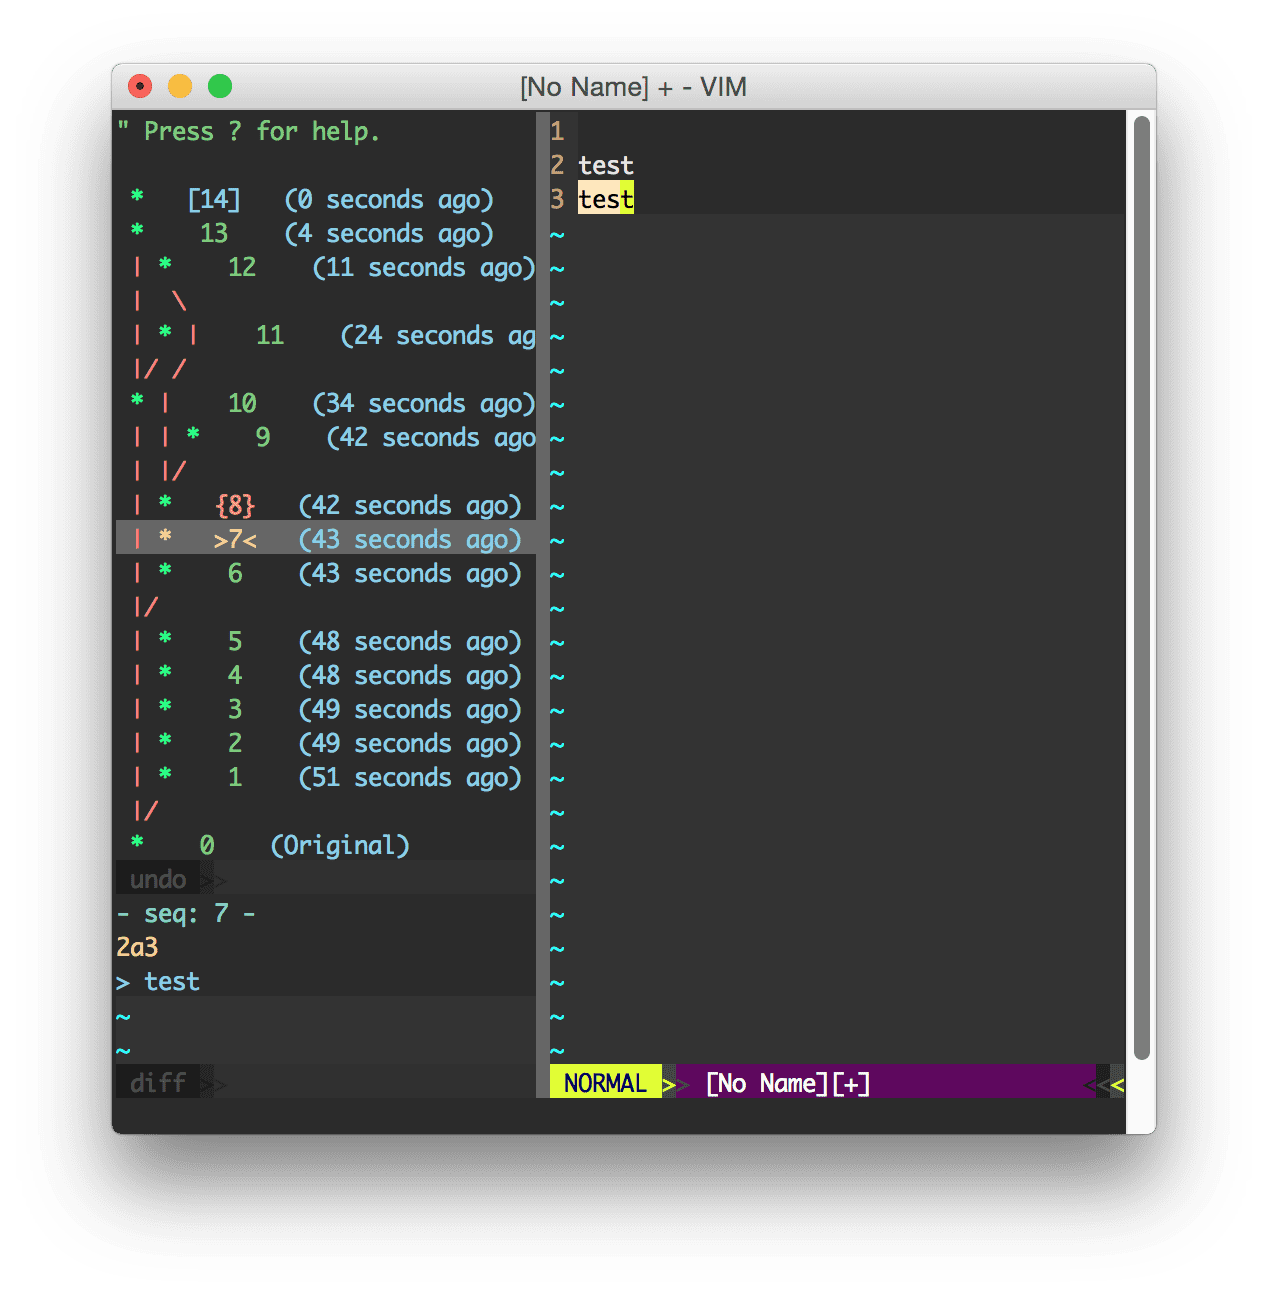
Vim terminal Shell GitHub software version control source code
The plug-in visualizes undo history and makes it easier to browse and switch between different undo branches (a vim feature that allows you to go back to a state when it is overwritten by a latest edit).

JavaScript/JS D3 AngularJS
An AngularJS directive for NVD3 re-usable charting library (based on D3). Easily customize your charts via JSON API.

JavaScript/JS presentations
Flowtime.js is a framework for easily building HTML presentations or websites.

JavaScript/JS
jVectorMap is a vector-based, cross-browser and cross-platform component for interactive geodata visualization. Features include: smooth zooming and panning, fully-customizable styling, markers, labels and tooltips.

R-project
With the DiagrammeR package you can create, modify, analyze, and visualize network graph diagrams, and output to RMarkdown documents, Shiny apps, other graph formats/image files.

TypeScript D3 small multiple
n3-line-chart is an easy-to-use JavaScript library for creating beautiful charts in AngularJS applications and it is built on top of D3.js.

JavaScript causal loop diagrams system dynamics explainables explorables scenario-based
LOOPY - a tool for thinking in systems. Allows you to model systems by simply drawing circles and arrows, generate interactive simulations that answer "what if" questions intuitively.

JavaScript/JS D3 tooltips annotate annotations microinteractions µ
D3.tip enables tooltips for D3.js visualizations; style and modify content, direction, hover behavior, and position relative to target elements; also features triangle extender functionality.

JavaScript/JS D3 React system dynamics explainables explorables scenario-based
Idyll is a markup language and toolkit for writing interactive articles. Idyll's reactive document model and standard component library decrease the amount of code needed to create high quality multimedia narratives.

JavaScript/JS
Dex : The Data Explorer -- A data visualization tool written in Java/Groovy/JavaFX capable of powerful ETL and publishing web visualizations.

Python statistics
iTorch is an IPython Kernel for Torch, with plotting (using Bokeh.js plots) and visualization of images, video and audio

R-project No License statistics statistical
The goal of patchwork is to make it ridiculously simple to combine separate ggplots into the same graphic. As such it tries to solve the same problem as gridExtra::grid.arrange() and cowplot::plot_grid but using an API that incites exploration and iteration.

Python GeoTIFF GeoJSON NumPy raster
Rasterio reads and writes geospatial raster data, such as GeoTIFF satellite imagery and terrain models, and provides a Python API based on NumPy N-dimensional arrays and GeoJSON.

JavaScript/JS Python PyGraphistry Cloud 0 Zero
Graphistry brings a human interface to the age of big and complex data. It automatically transforms your data into interactive, visual investigation maps built for the needs of analysts.
JavaScript/JS D3 time series
A time based / event series interactive visualization using d3.js

JavaScript/JS jQuery microinteractions µ video
Prettier embeds for your YouTube videos - with nice options like high-res preview images, advanced customization of embed options, and optional FitVids support. Choose from one of eight thumbnail sizes and implement programmatically or via HTML5 data- attributes.
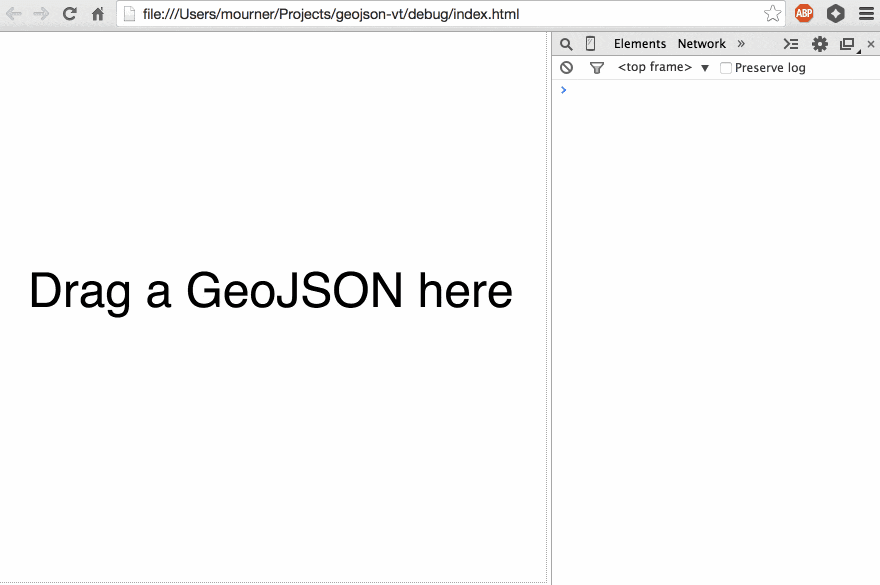
JavaScript/JS GeoJSON Mapbox WebGL D3 Leaflet tilesets tilemaps
A highly efficient JavaScript library for slicing GeoJSON data into vector tiles on the fly, primarily designed for rendering and interacting with large geospatial datasets on the browser side (without a server).

Python machine learning ML neural network ANN CNN deep learning
Given a network architecture and its pre-trained parameters, this tool calculates and visualizes the loss surface along random direction(s) near the optimal parameters.

Python content natural language processing NLP latent Dirichlet allocation LDA
pyLDAvis creates interactive web-based visualizations of topics extracted from a fitted latent Dirichlet allocation (LDA) topic model that has been applied to a specific corpus of text data.
JavaScript/JS
Muze is a data visualization library which uses a layered Grammar of Graphics (GoG) to create composable and interactive data visualization for web. It uses a data-first approach to define the constructs and layers of the chart, automatically generates cross-chart interactivity, and allows you to over-ride any behavior or interaction on the chart.

Python machine learning ML neural networks ANN CNN CV Keras TensorFlow Caffe
Fabrik is an online collaborative platform to build, visualize and train deep learning models/neural nets via a simple drag-and-drop interface. Supports Caffe, Keras, and TensorFlow.

Python machine learning ML neural network ANN CNN Keras
A Python visualization library that works with Keras (including Sequential and Dense). It uses graphviz to create a presentable graph of the neural network you are building with just a line of code.

Python JavaScript/JS content natural language processing NLP tf-idf
Visualize linguistic variation between document categories in small-to-medium-sized corpora using a scatterplot. Each axis corresponds to the rank-frequency of a term in a given category of documents.

JavaScript/JS React Vue AngularJS
A toolkit fit for data vis engineer based on G2. Viser support React, Vue and AngularJS. The main purpose of this library is to help you to write charts in web applications without any pain.

Python machine learning ML neural networks ANN CNN CV Keras TensorFlow Flask
Picasso is a Flask application for visualizing DNNs through partial occlusion and saliency maps. It was developed to work with checkpointed Keras and Tensorflow networks; may require extra config parameter for Theano.
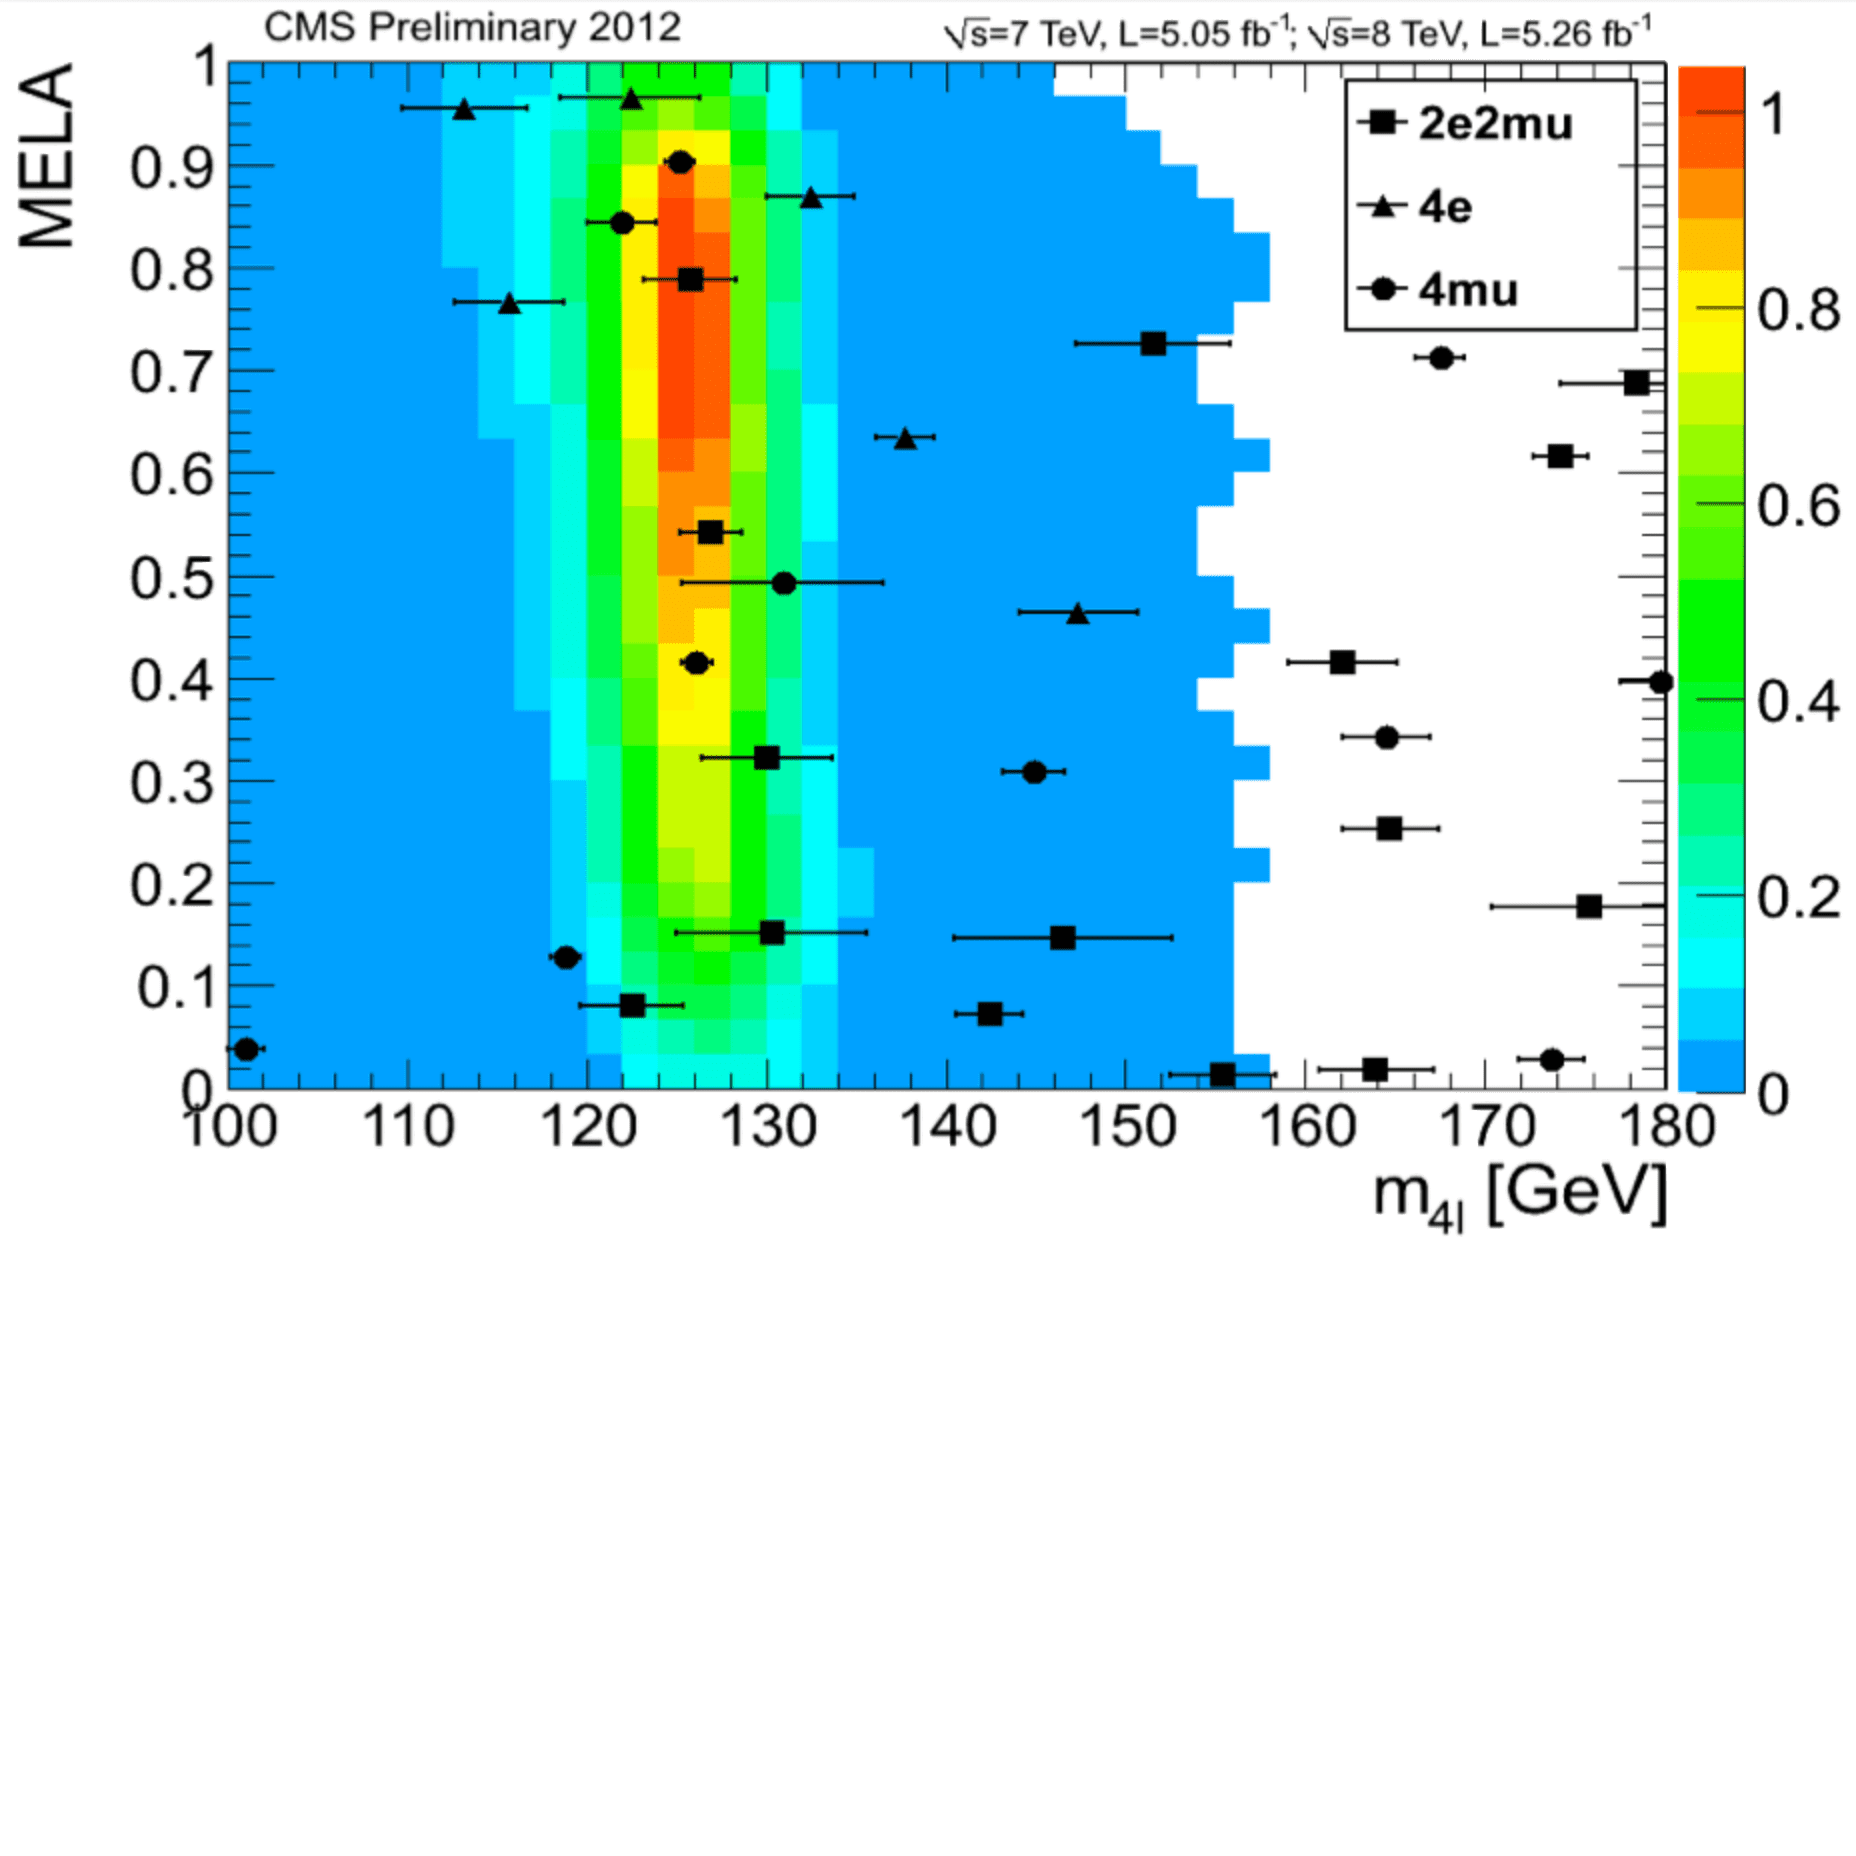
C++ statistics statistical scientific
The ROOT system allows users to process, analyze, and visualize large amounts of data in a very efficient way; includes histograming methods, curve fitting, function evaluation, minimization, graphics and visualization classes, and general parallel processing.

JavaScript/JS jQuery vector
jQuery Mapael is a jQuery plugin based on raphael.js that allows you to display dynamic vector maps. Includes zoom, panning, resizing, tooltips, linked views, and selective colorization.

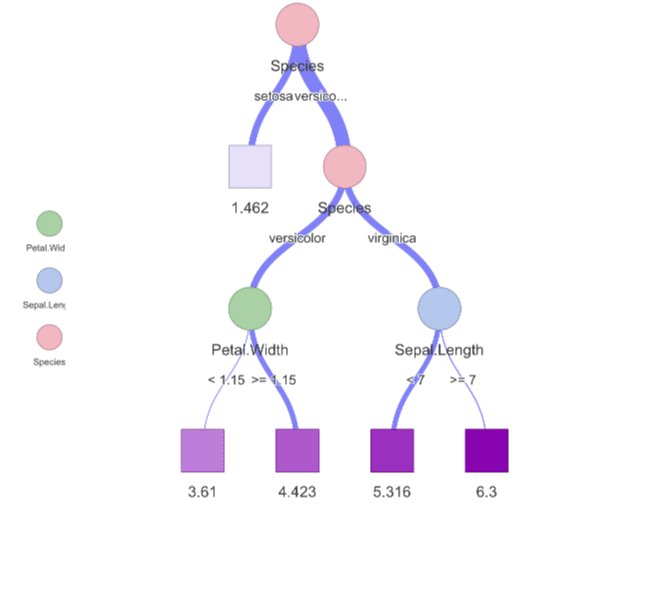
Python decision trees ml machine learning gradient boosting random forests anaconda
A general-purpose Python library for scikit-learn decision tree visualization and model interpretation; well-suited for gradient boosting machines and random forests; generates SVG-based outputs.

JavaScript/JS Mapbox GeoJSON MapReduce
A fast JavaScript library for geospatial point clustering for browsers and Node. Loads an array of GeoJSON Feature objects and supports MapReduce, tiling, clustering, click to zoom, and other forms of aggregation.
JavaScript/JS D3 React
An open source library that enables developers to reroute D3 output to React's virtual DOM. With a few lines of code, you can now combine the power of React with the flexibility of D3!

CSS tooltip typography minified microinteractions µ
A compact (1kb) tooptip library with accessibility baked in. Simply add an aria-label="your annotation" followed by role="tooltip" (as well as a position modifier) to the element you want to annotate.

JavaScript/JS presentations
DZSlides is a one-file HTML template to build slides in HTML5 and CSS3. template.html is the only file you need. Edit the file, add your content, change the style, and you're done. To see the slides in action, just load the file in your browser.

CoffeeScript causal loop diagrams system dynamics explainables explorables scenario-based
Apparatus is a hybrid graphics editor / programming environment for creating interactive diagrams that communicate a mental model or convey a new way of seeing a problem or system.

JavaScript/JS jQuery annotate annotations typography microinteractions µ
Marginotes takes jQuery selections and adds notes to the margin with the text provided in HTML attributes. If you don't want to use jQuery, there's also a vanilla JavaScript version.

JavaScript/JS Twitter tweets
Built as a single page application, BirdWatch is a reactive web application for visualizing live tweets from the Twitter Streaming API with live search functionality and ongoing content updating.
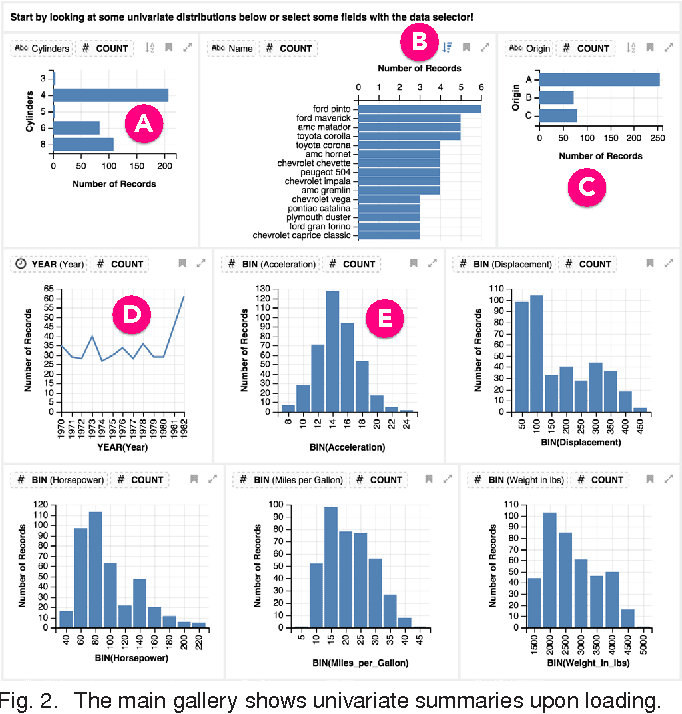
TypeScript time series bigdata dashboards small multiple
Voyager 2 is a data exploration tool that blends manual and automated chart specification, with wildcards, related views suggestions and multiple charts in parallel.

Julia scientific
Plots is a plotting API and toolset. Do more with less. Complex visualizations become easy. Stop reading so much documentation. Commands should "just work." Less code means fewer mistakes and more efficient development/analysis.
JavaScript/JS Vega small multiple No License
Lyra is an interactive environment that makes custom visualization design accessible to a broader audience. With Lyra, designers can map data to the properties of graphical marks to author expressive visualization designs without writing code.

Swift easy time series music audio
FDWaveformView is an easy way to display an audio waveform in your app. It is a nice visualization to show a playing audio file or to select a position in a file.

JavaScript/JS D3
Often data sets are hierarchical, but are not in a tree structure, such as genetic data. In these instances d3-hierarchy may be inapposite, and d3-dag may be more suitable.
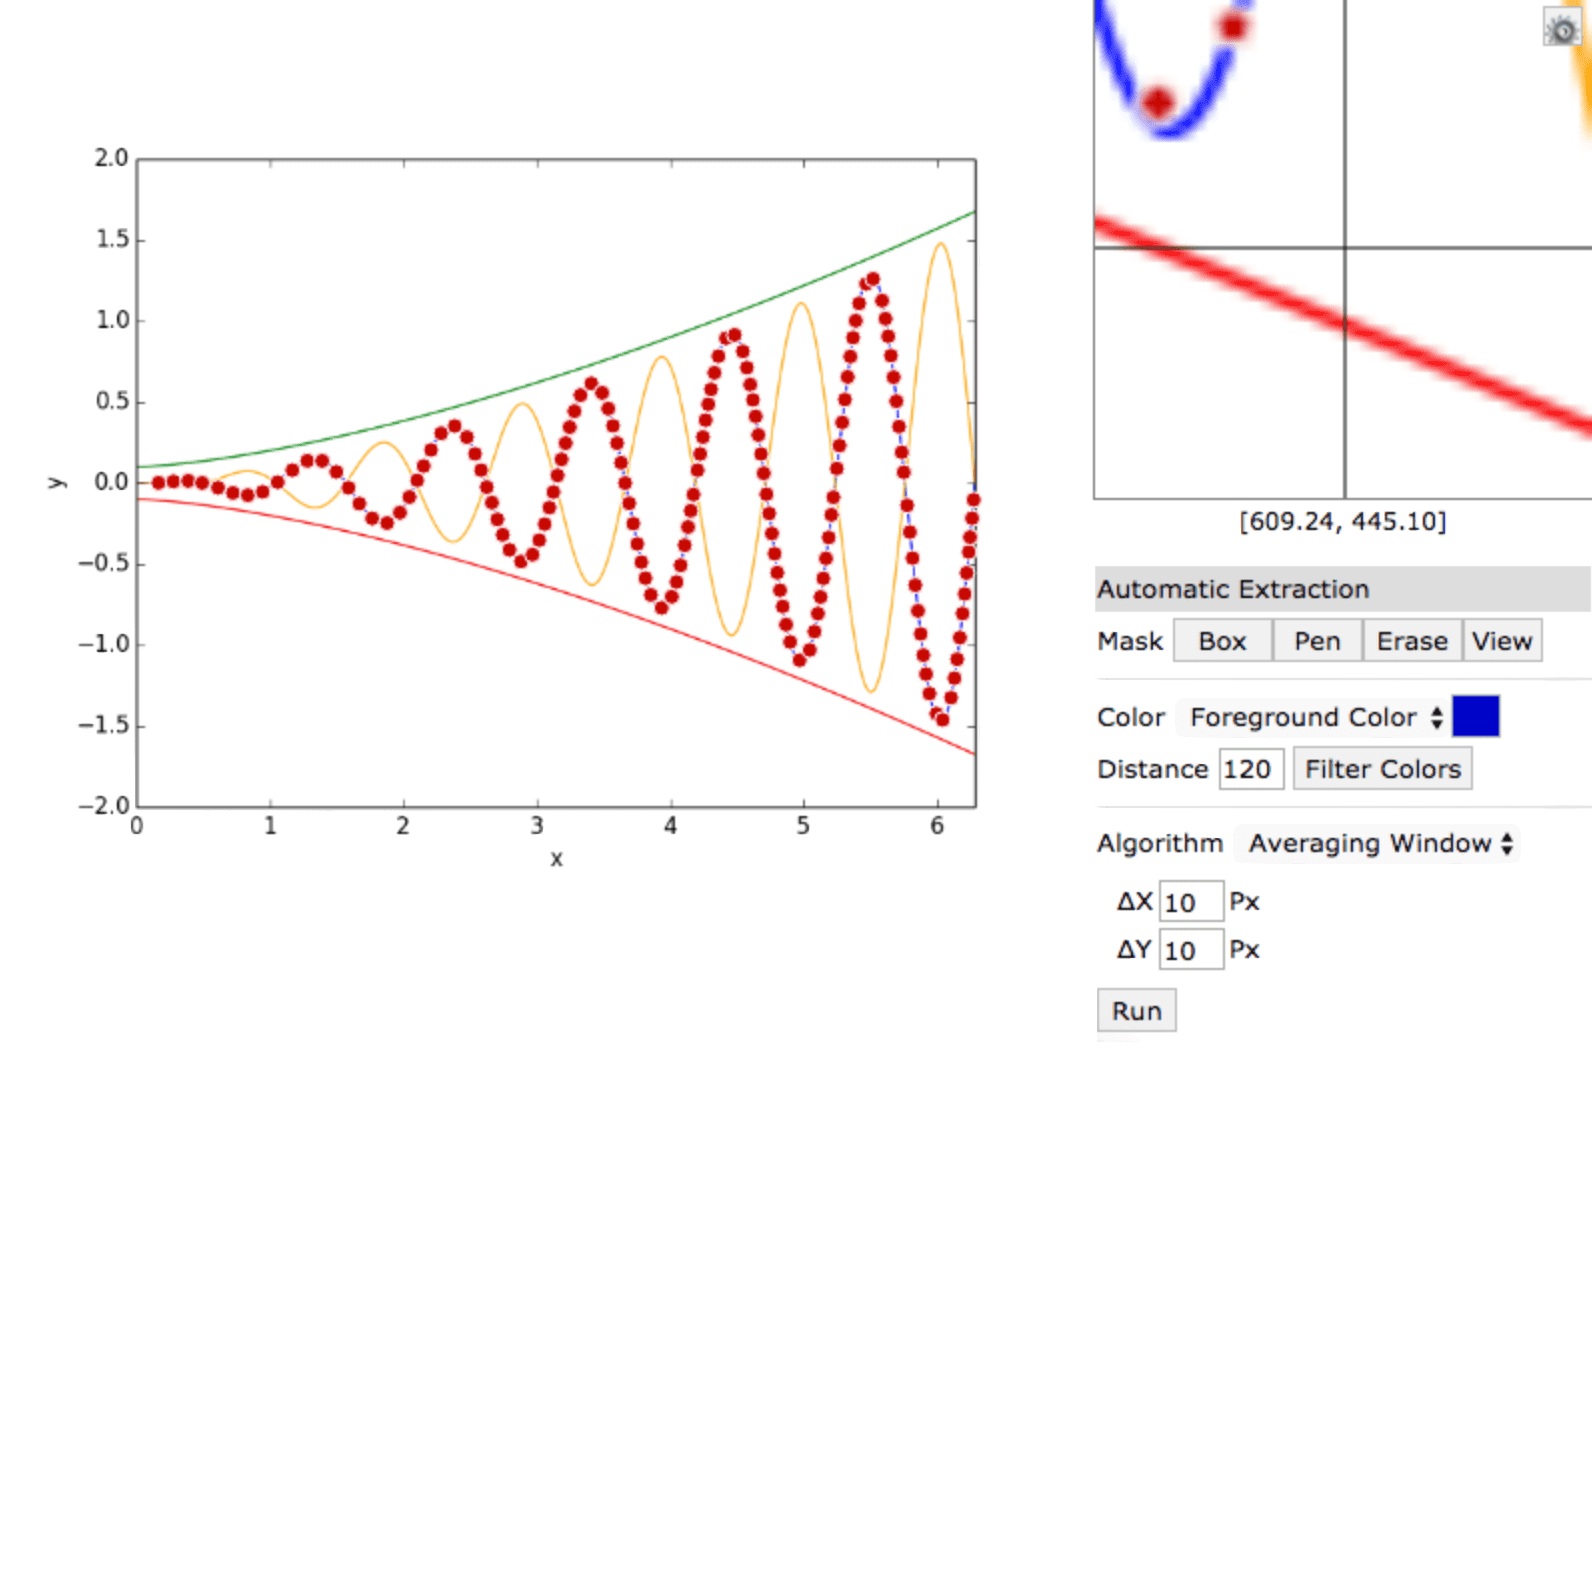
JavaScript/JS Python Polar
A web based tool to extract numerical data from plot images. Supports XY, Polar, Ternary diagrams and Maps. This is an opensource tool that is used by thousands and cited in over 600 published articles.

JavaScript/JS D3
MSAGL is a .NET library for graph layout. You can create graphs either programmatically or from JSON objects, have MSAGL create a layout for it, and then render to an HTML <canvas> or to an SVG block.

JavaScript/JS D3 Airy Aitoff Albers equal area azimuthal Bertin conic cylindrical epicycloidal HEALPix Mercator Miller Robinson Winkel Van der Grinten and Natural Earth
Includes Airy, Aitoff, Albers (equal-area), azimuthal, Bertin, conic, cylindrical, epicycloidal, HEALPix, Mercator, Miller, Robinson, Winkel, Van der Grinten, and Natural Earth projections.

JavaScript/JS D3 mathematical notation mathematics Venn Euler sets
A javascript library for laying out area proportional venn and euler diagrams.

JavaScript/JS reverse engineer extract utility SVG
A Chrome-specific bookmarklet that extracts SVG nodes and accompanying styles from an HTML document and downloads them as an SVG file—A file which you could open and edit in Adobe Illustrator, for instance. Because SVGs are resolution independent, it's great for when you want to use web technologies to create documents that are meant to be printed (like, maybe on newsprint). It was created with d3.js in mind, but it should work fine with any SVG.

JavaScript/JS Python GeoJSON choropleth
A Jupyter / Leaflet bridge enabling interactive maps in the Jupyter notebook. Define basemap, load GeoJSON, use leafletjs primitives as well as splitmap controls, and generate rich choropleths.

Java SE UML
UMLet is an open-source UML tool with a simple user interface: draw UML diagrams fast, add custom elements, export to EPS, PDF, JPG, SVG, and clipboard, and share using Eclipse.

Python matplotlib cartopy
Geoplot is a high-level Python geospatial plotting library. Built as an extension to cartopy and matplotlib, it is designed to make mapping easy, almost like seaborn for geospatial data.
JavaScript/JS machine learning ML neural network ANN CNN deep learning Caffe
A web-based tool for visualizing neural network topologies (or technically, any directed acyclic graph), featuring an inline editor for specifying network definitions; currently limited to valid Caffe prototext.

JavaScript/JS D3 color
This module implements the HSLuv (Hue, Saturation, Lightness) color space.

Python machine learning ML neural network ANN CNN deep learning TensorFlow TensorBoard
A visualization library you can use to better understand your convolutional neural network. Uses the TensorFlow library as the backend and displays generated images in TensorBoard.

JavaScript/JS juxtaposition steganography
JavaScript / Canvas based image diff utility with Jasmine matchers for testing canvas.

JavaScript/JS presentations
bigpicture.js is a library that allows infinite panning and infinite zooming in HTML pages.


Python
TabPy (Tableau Python Server) is external server implementation which allows expanding Tableau with executing Python scripts in table calculation.

Python dashboards
Bowtie is a library for writing dashboards in Python. No need to know web frameworks or JavaScript, focus on building functionality in Python. Interactively explore your data in new ways! Deploy and share with others!

JavaScript/JS heatmap
A super-tiny JavaScript library for drawing heatmaps with Canvas. Inspired by heatmap.js, but with focus on simplicity and performance. Powers Leaflet.heat, a heatmap plugin for Leaflet.

Python WebGL scientific space orbitology
Glumpy is a python library for scientific visualization that is both fast, scalable and beautiful. Glumpy offers an intuitive interface between numpy and modern OpenGL.

JavaScript/JS machine learning ML neural network ANN CNN deep learning t-SNE
tSNEJS is an implementation of t-SNE visualization algorithm in Javascript. Given a dataset with known pairwise differences, t-SNE visualization can help identify clusters in the data.
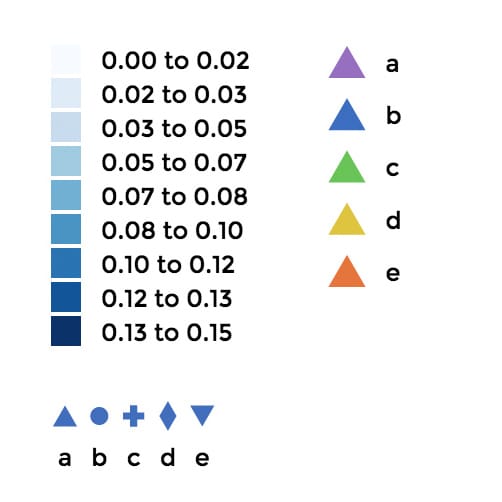
JavaScript/JS annotate annotations D3 microinteractions µ
Create reusable legends in SVG; customize color, ascending and descending scale, thresholds, symbology, margins, padding, and label formatting for different use cases. Available for both D3-v4 and D3-v3.

R-project annotate annotations microinteractions µ ggplot2
ggrepel provides geoms for ggplot2 to separate overlapping text labels. Text labels repel away from each other, away from nearby data points, and away from the edges of the plotting area.

Python natural language processing NLP munging wrangling cleaning dimensionality preparation
An extensible framework for domain-specific probabilistic parsers, capable of parsing messy or unstructured U.S. addresses, personal names, surnames, or brands of corporate entities.

Python machine learning ML data primitives
A simple Python data-structure visualization tool that started out as a List Of Lists (lol) visualizer but now handles arbitrary object graphs, including function call stacks.

JavaScript/JS annotate annotations D3 microinteractions µ
Use D3-annotation with built-in annotation types (callouts, tooltips, connectors, arrows, and circles), or extend it to generate custom annotations for your visualizations. It is made for D3-v4 in SVG.
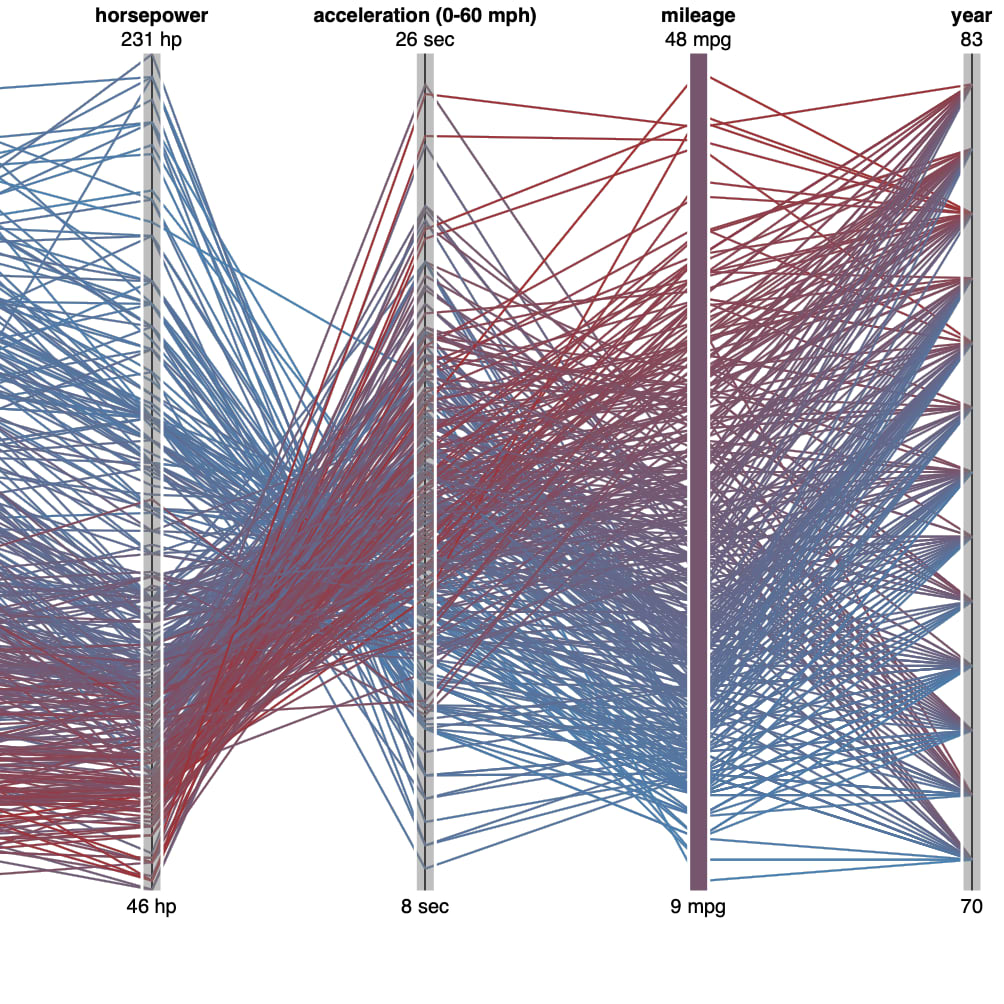
JavaScript/JS D3 No License parallel coordinates


Python Pandas text K-means preprocessing preprocessor TF-IDF natural language processing NLP munging wrangling cleaning dimensionality preparation
Texthero is a Python/Pandas toolkit built to work with text-based datasets. Includes keyphrase/keyword extraction, named entity recognition, topic modeling, and TF-IDF, term frequency, pre-trained and custom word-embeddings.

JavaScript/JS D3 minified easy financial
A collection of components that make it easy to build interactive charts with D3.

JavaScript/JS
Allows you to write json specification in simple yaml and uses marked and vega-lite (or vega) to convert those specific code blocks in to svg.

Python financial time series
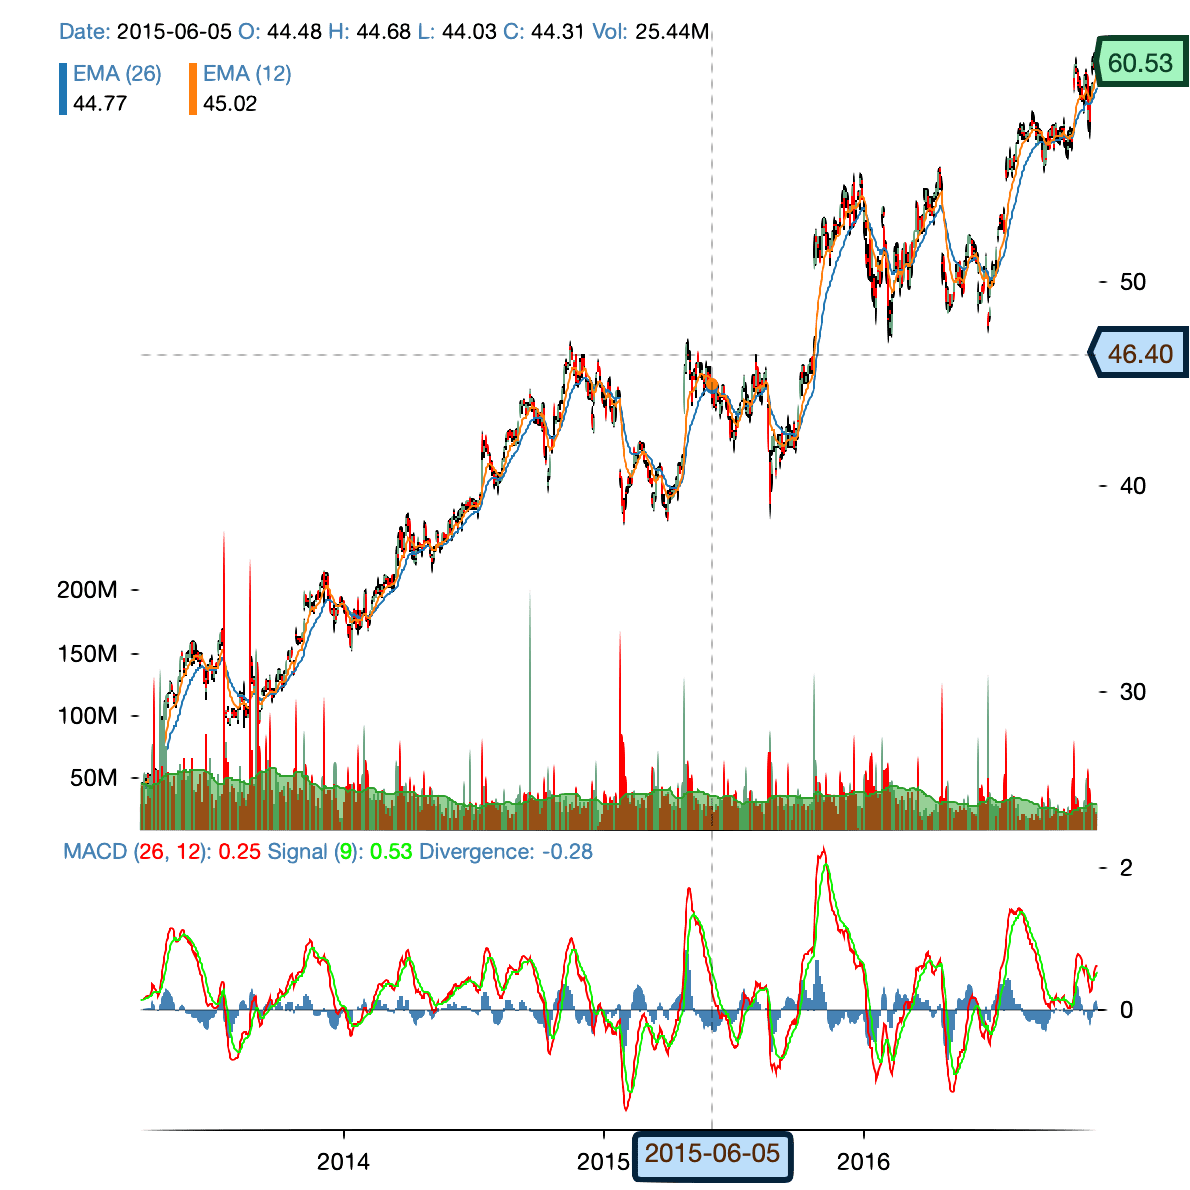
Tuchart is a visualization interface for the Chinese stock market. Tuchart supports candlestick charts, price charts, tick data, high-frequency data and distribution of top shareholders for individual stocks.

Python Keras machine learning ML neural network ANN CNN deep learning
Visualize an RNN in Keras that can translate human dates (“November 5, 2016”, “5th November 2016”) into a standard format (“2016–11–05”). In particular, we want to gain some intuition into how the neural network did this.

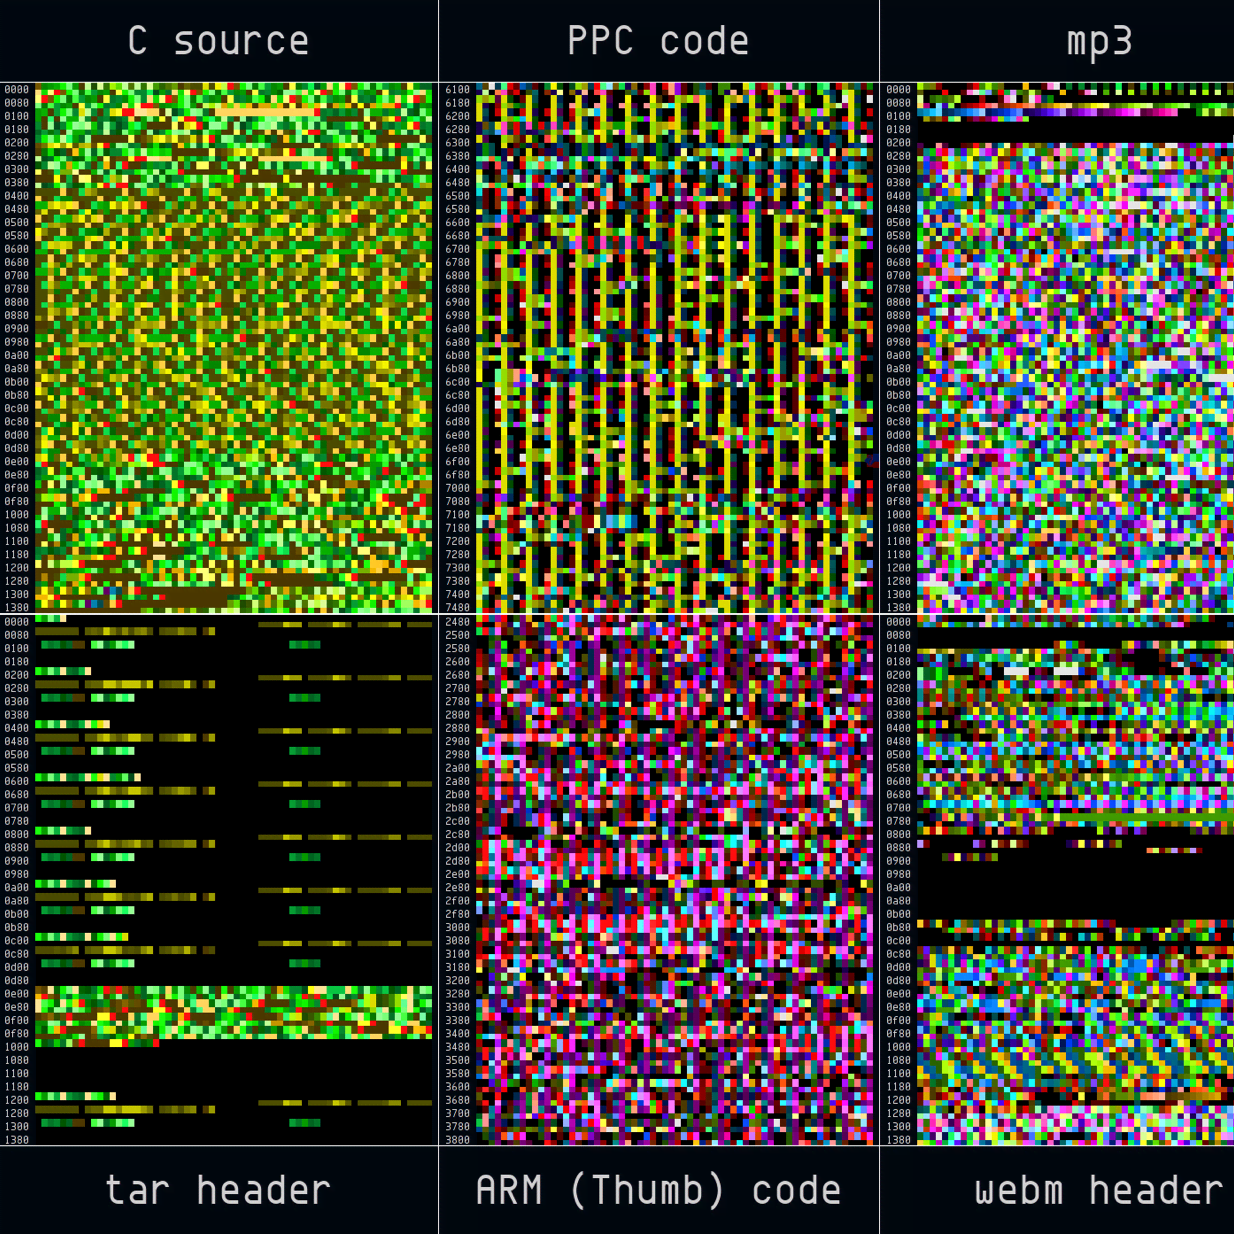
C++ Python fingerprinting utilities statistics statiscal
It is a very difficult task for a human to notice subtle patterns in large amounts of binary data, however, us humans are very good at finding patterns in images. Statistical visualizations let you find the important bits in a sea of binary data - all at a glance.

JavaScript/JS OpenTripPlanner (OTP) subways commuter rail mass transit transport
Transitive takes in information describing specific transport network elements (routes, stops, journeys) -- typically from OpenTripPlanner -- and produces a stylized schematic transit map of those elements.

Python matplotlib
Cartopy is designed for geospatial data processing in Python. It can produce publication quality maps and other geodata analyses using the powerful PROJ.4, NumPy, Shapely, and matplotlib libraries.

JavaScript/JS jQuery typography microinteractions µ
Inspired by Medium, Reading Time is a simple, lightweight jQuery plugin used to display the estimated time it will take users to read a certain piece of text given a words per minute baseline.

JavaScript/JS I2
A tool for visualizing your Google Location History; takes raw Google Takeout data and produces an interactive heatmap of your movements over time. Works directly in browser with no additional packages.

JavaScript/JS D3 SVG
A JavaScript library that pre-renders d3 visualizations into inline SVG elements, to reduce perceived page-load time and cut down on unwanted paint flashes.

Python brain neurology scientific bio
Nilearn is a Python module for fast and easy visualization of brain images and statistical learning on NeuroImaging data.

JavaScript/JS shadow color
solgraph generates a DOT graph that visualizes function control flow of a Solidity contract and highlights potential security vulnerabilities.

R-project Leaflet bridge utilities
As one of the most popular open-source geospatial libraries, Leaflet maps appear on The New York Times, The Washington Post, GitHub, and Flickr. This R package makes it easy to integrate Leaflet maps with R.
Python Bokeh Matplotlib HoloViews
Panel provides tools for easily composing widgets, plots, tables, and other viewable objects and controls into control panels, apps, and dashboards; works with Bokeh, Matplotlib, HoloViews, and others.

R-project raster ggplot2 tilesets tilemaps
ggmap is an R package that makes it easy to retrieve raster map tiles from popular online mapping services like Google Maps and Stamen Maps. From there, users can plot them using the ggplot2 framework.

JavaScript/JS Three.js GL
A JavaScript framework to create and visualize 3D models. JSModeler contains a built-in viewer to show models. The viewer needs the Three.js framework, and we can initialize it for an existing canvas in the onload event of the page.

Python Javascript/JS WebGL Three.js utilities
A Python / ThreeJS bridge utilizing the Jupyter widget infrastructure.

JavaScript/JS D3 GitHub software version control source code
This tool visualizes source code repositories using an interactive tree rendered on the client side. Each disc represents a file, with a radius proportional to the number of lines of code (loc).

JavaScript/JS
StoryMapJS is a simple cartographic narrative tool. If you're not a programmer, you don't need to spend much time on the GitHub page; instead, visit StoryMapJS at the Northwestern University Knight Lab.

JavaScript/JS D3 Neo4j graph
Neo4j graph visualization using D3.js compatible with multiple data formats; info panel shows nodes and relationships information on hover, with extensive customization.

JavaScript/JS D3 Markdown
Markmap is a Javascript component that will visualize your markdown documents as mindmaps; it supports multiple file formats with simple navigation and rich content overviews.
Python vector georectified maps geotagging polygon culture random
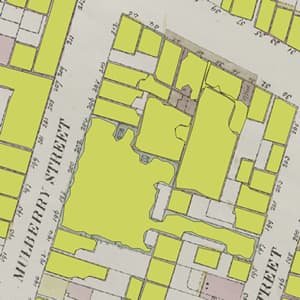
Automates geographic polygon and attribute data extraction from maps and georectified images. Previously it took 3 years to produce 170,000 polygons with attributes; Map Vectorizer can do that in about 24 hours.

R-project count
Square pie charts (a.k.a. waffle charts) can be used to communicate parts of a whole for categorical quantities. To emulate the percentage view of a pie chart, a 10x10 grid should be used with each square representing 1% of the total.

Python weather maps meteorological meteorology radar hurricanes
MetPy is a collection of tools in Python for reading, visualizing and performing calculations with weather data.

JavaScript/JS D3
Alchemy is an easily customizable graph drawing application built in D3.js so that developers can get up and running with network visualization applications without much overhead.
JavaScript/JS musical literature literary culture cultural random
Generates interactive self-similarity matrices from text. Given an input of length n tokens, constructs an n x n matrix, where (i, j) is filled in iff the i th and j th words are the same after normalization.

Python raster Leaflet Pandas WebGL MapBox
Create Mapbox GL visualizations natively in Jupyter notebooks. Built on top of the raster Leaflet map library and similar to Folium, it drops directly into Jupyter with much higher performance for large data sets.

JavaScript/JS dashboards time series
Keshif is a web-based visualization and analytics tool that lets you explore datasets quickly. Explore your data in rich, automated, super-interactive charts & dashboards in seconds.

JavaScript/JS minified easy
A go-to library for data visualization. When you don't have time to learn new technologies. When you need a simple yet powerful and flexible drop-in data visualization solution. Advanced serial charts We made it easy to display complex data visualizations. Combine various graph types on a single chart. Create clusters, or stacks, or clusters of stacks. Control the widths, open and close values, apply coloring based on value thresholds or changes, recalculate the values automatically. Use various value scales, including date and time. Those are just a few examples of what you can do. Superior time-based scales When displaying flat series just doesn't cut it, amCharts comes in with true date/time scale support. Plot your time-based data on a natural date or time scale, at a granularity down to milliseconds. Let the chart automatically calculate distances, gaps and similar characteristics. Zoom and pan using cursor, scrollbar or touch gestures. Micro-charts and sparklines Reduce the charts to complete minimal configuration to produce tiny but usable micro charts by disabling a few components like axes, legends and margins.

JavaScript/JS D3 Sankey thermal
Sankey diagrams visualize the directed flow between nodes in an acyclic network. To that end, D3-Sankey offers multiple alignment, scaling, and layout methods, as well as categorical data handling.

choropleth color
Built and maintained by Axis Maps, colorbrewer2 is a Web-based color scheme selection tool based on Cynthia Brewer's research into colorblind safe, photocopy safe, and print-friendly color schemes.

C++ space orbitology planetarium orrery 3D exponential zoom random
A real-time three-dimensional planetarium simulator, Celestia includes exponential zoom and comes with a large catalog of stars, galaxies, planets, moons, asteroids, comets, and spacecraft.


C++ scientific point cloud streaming sensor
QT5 based application to display time series in plots, using an intuitive "drag and drop" interface. It can be used either to load static data from file or connect to live streaming of data.

PHP JavaScript/JS color
Colors for data scientists. Generate and refine palettes of optimally distinct colors. iWantHue allows you to generate palettes of colors. It is about mastering the properties of a palette by setting a range of Hue, Chroma (unbiased saturation) and Lightness. You can generate palettes of any size or just get the generator for a javascript project. The algorithm optimizes the perceptive distance in the color subspace, ensuring an optimal readability.

Java SE timelines
Time Flow is an open-source timeline built to help journalists analyze temporal data. The application offers several view modes--timelines, calendar, list, table--to help explore thousands of data points.

JavaScript/JS D3
D4 is a friendly charting DSL for D3. The goal of D4 is to allow developers to quickly build data-driven charts with little knowledge of the internals of D3.

R-project
Circular layouts are an efficient way for visualizing complex patterns behind multi-dimensional data using various combinations of sectors, tracks, chords, segments, and links.

JavaScript/JS D3 flame graphs
A D3.js plugin that produces flame graphs from hierarchical data.

JavaScript/JS pie
Pizza is a responsive pie, donut, bar, and line graph charting library based on the Snap SVG framework from Adobe. It focuses on easy integration via HTML markup and CSS instead of JavaScript objects, although you can pass JavaScript objects to Pizza as well.

C C++
Graphviz is an open source graph visualization tool which shows structural information for networking, bioinformatics, software engineering, database design, and machine learning.
Project GitLab

Python spacing matplotlib ggplot2
Inspired by the ggrepel package for ggplot2 in R, AdjustText is a small library for automatically adjusting point and text positions in matplotlib plots to minimize collision and overlap.

Python NumPy arrays scalars transformation conversion utility projections
Transforms geographic coordinates (lat/lon) into different map projections (x/y). Can convert directly from one coordinate system to another. Optimized for NumPy arrays; can also handle Python arrays, lists, or scalars.
Clojure
Rhizome is a library for visualizing graph and tree structures with multiple keyword arguments for user-defined clustering, hierarchy, labeling, and rendering options. Requires Graphviz.
C color terminal Shell binary data hexdump fingerprinting magic numbers documentation security
pixd is a tool for visualizing binary data using a colour palette. It is in a lot of ways akin to a hexdump tool, except using coloured squares to represent each octet. pixd uses 24-bit color SGR escape sequences.

JavaScript/JS minified microinteractions µ
Lightweight (< 3Kb), dependency-free javascript library to dynamically show the number of unread notifications in your webpage title.

Python D3 treemaps
py_d3 is an IPython extension which adds D3 support to the Jupyter Notebook environment. D3 is a powerful JavaScript data visualization library, while Jupyter is an intuitive browser-hosted Python development environment. Wouldn't it be great if you could use them together? Now you can.

JavaScript/JS D3
d3Kit provides thin scaffold for creating reusable and responsive charts with D3. It aims to relieve you from the same groundwork tasks you found yourself doing again and again.

basemaps
Modest Maps is a small, extensible, free library for developers who want to design interactive maps; provides a core set of features in a tight, clean package with plenty of hooks for additional functionality.

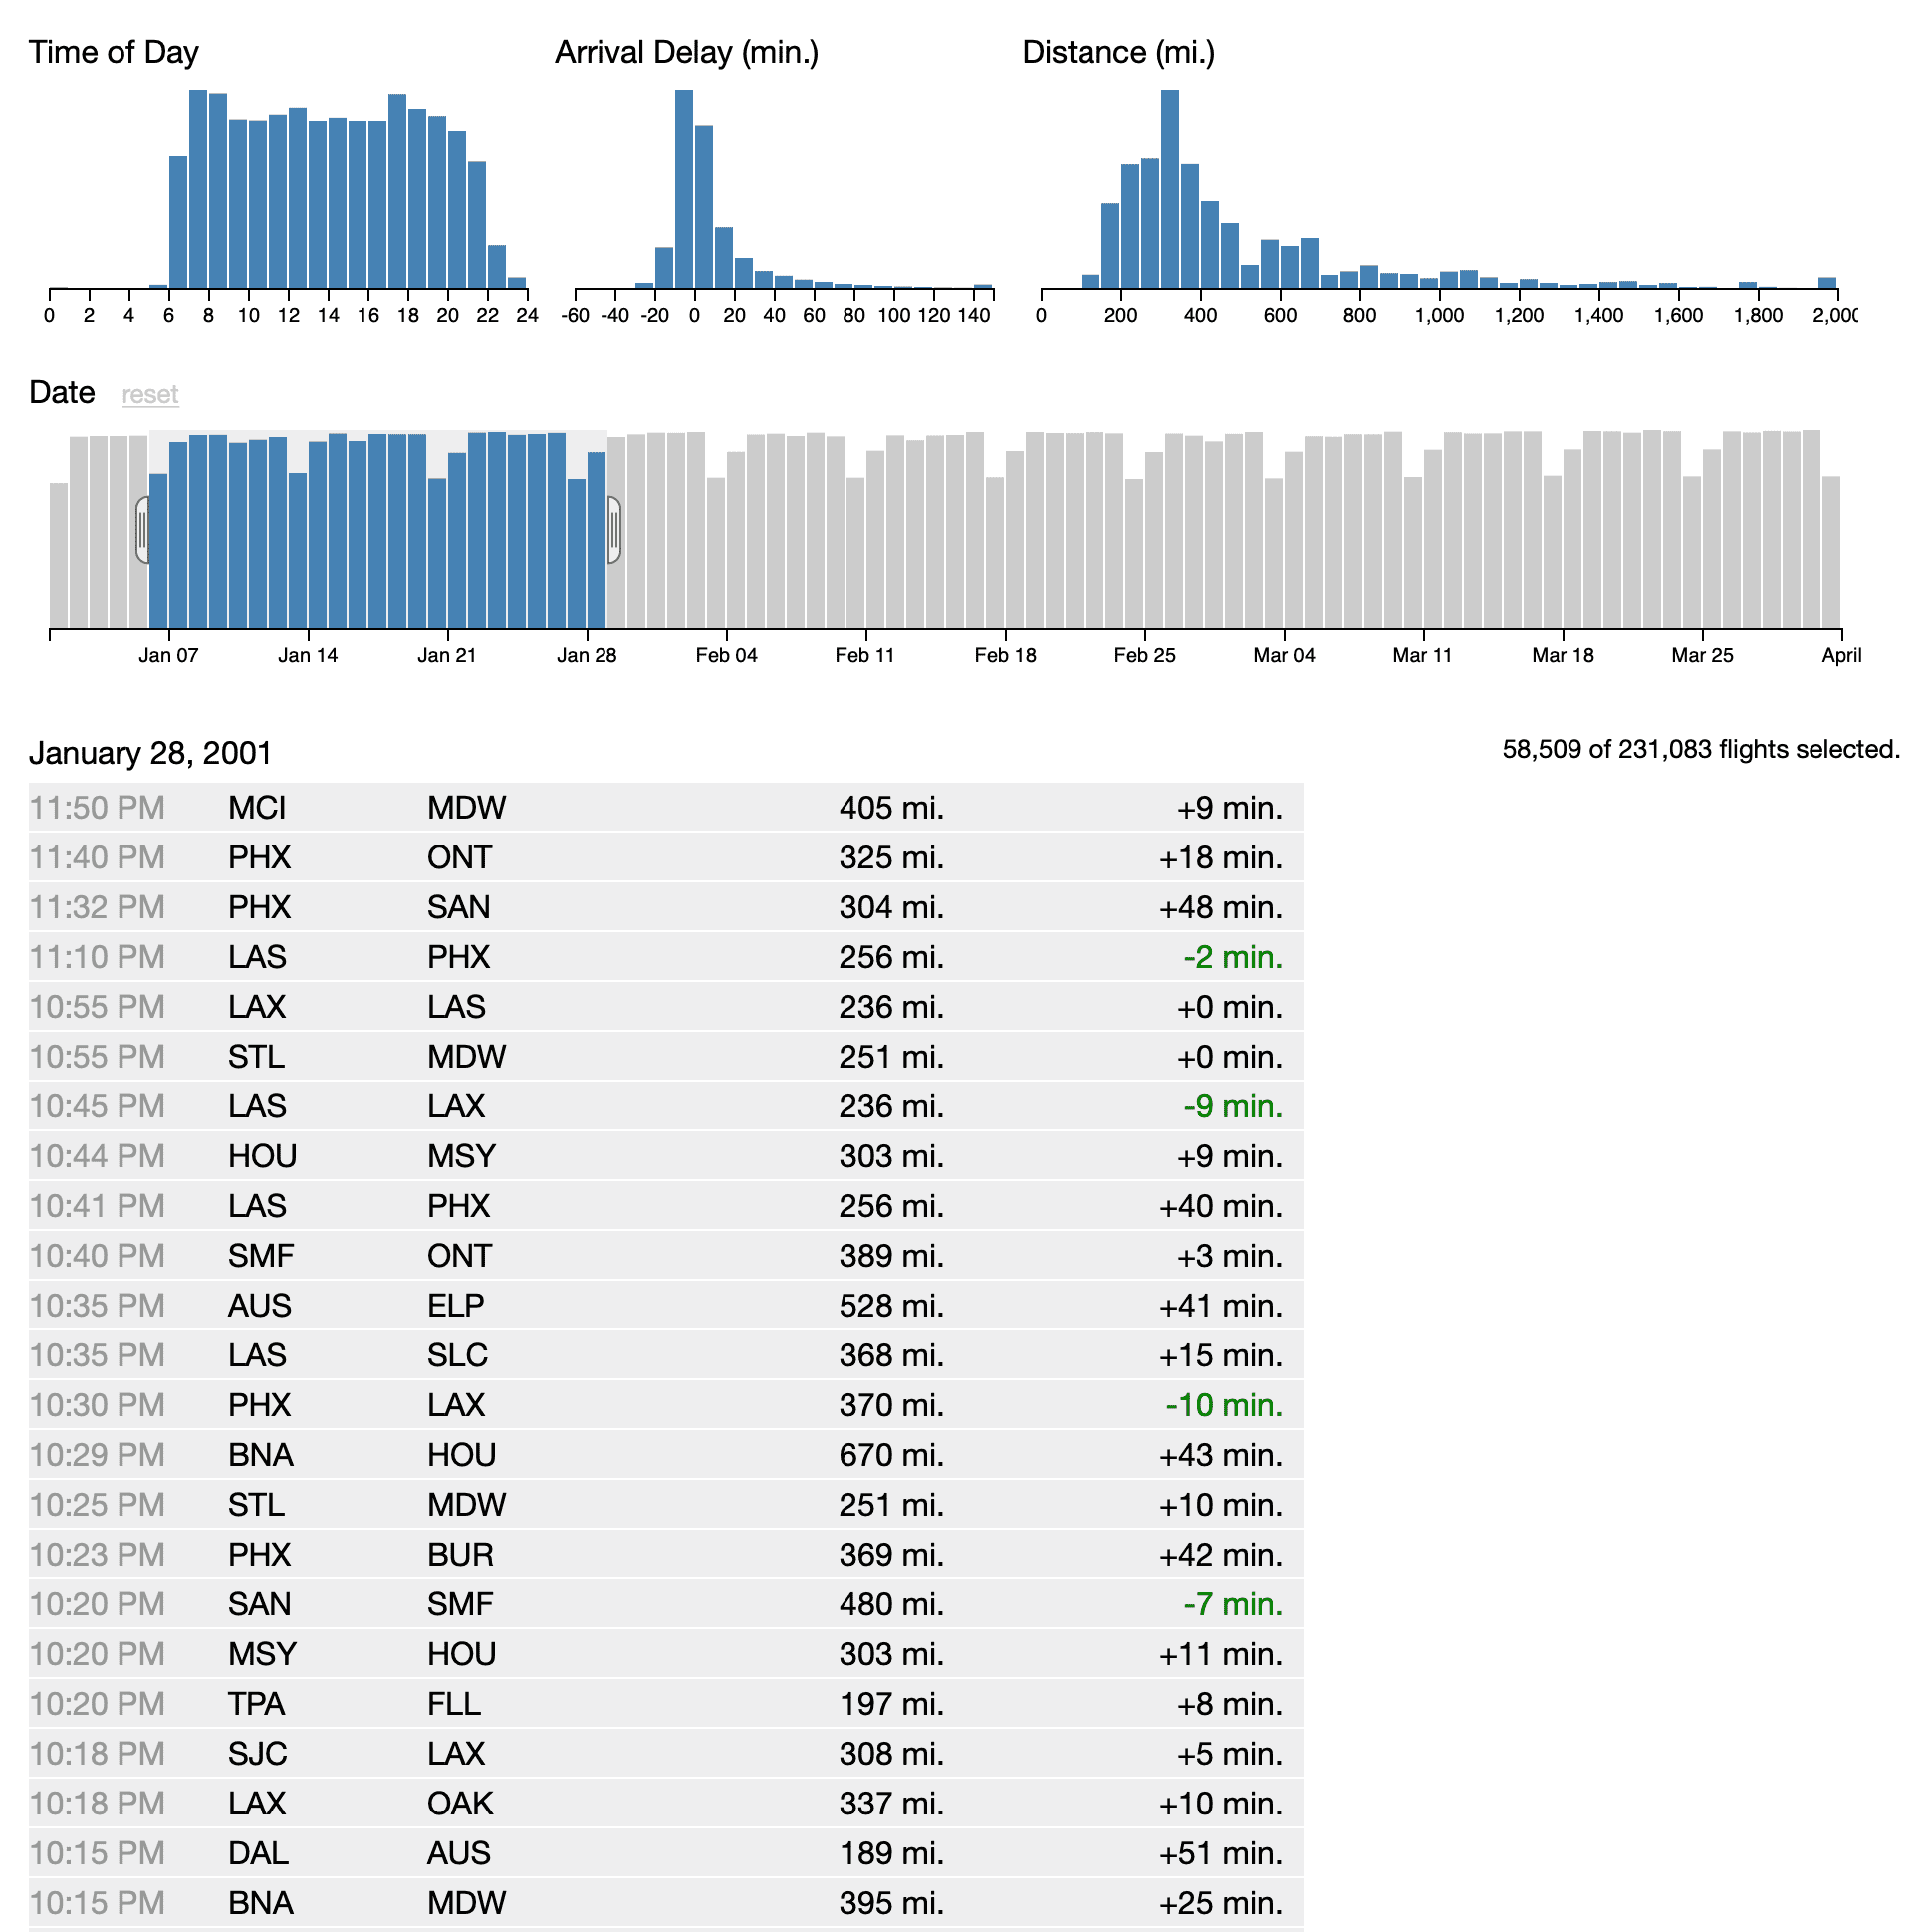
Python bigdata time series small multiple
Crossfilter millions of records without latencies. This project is work in progress and not documented yet. Please get in touch if you have questions. The largest experiments we have done so far is 10M flights in the browser and ~180M flights or ~1.7B stars when connected to OmniSci Core (formerly known as MapD).

JavaScript/JS
CubesViewer displays the results of DataBrewery's Python Online Analytical Processing (OLAP) data
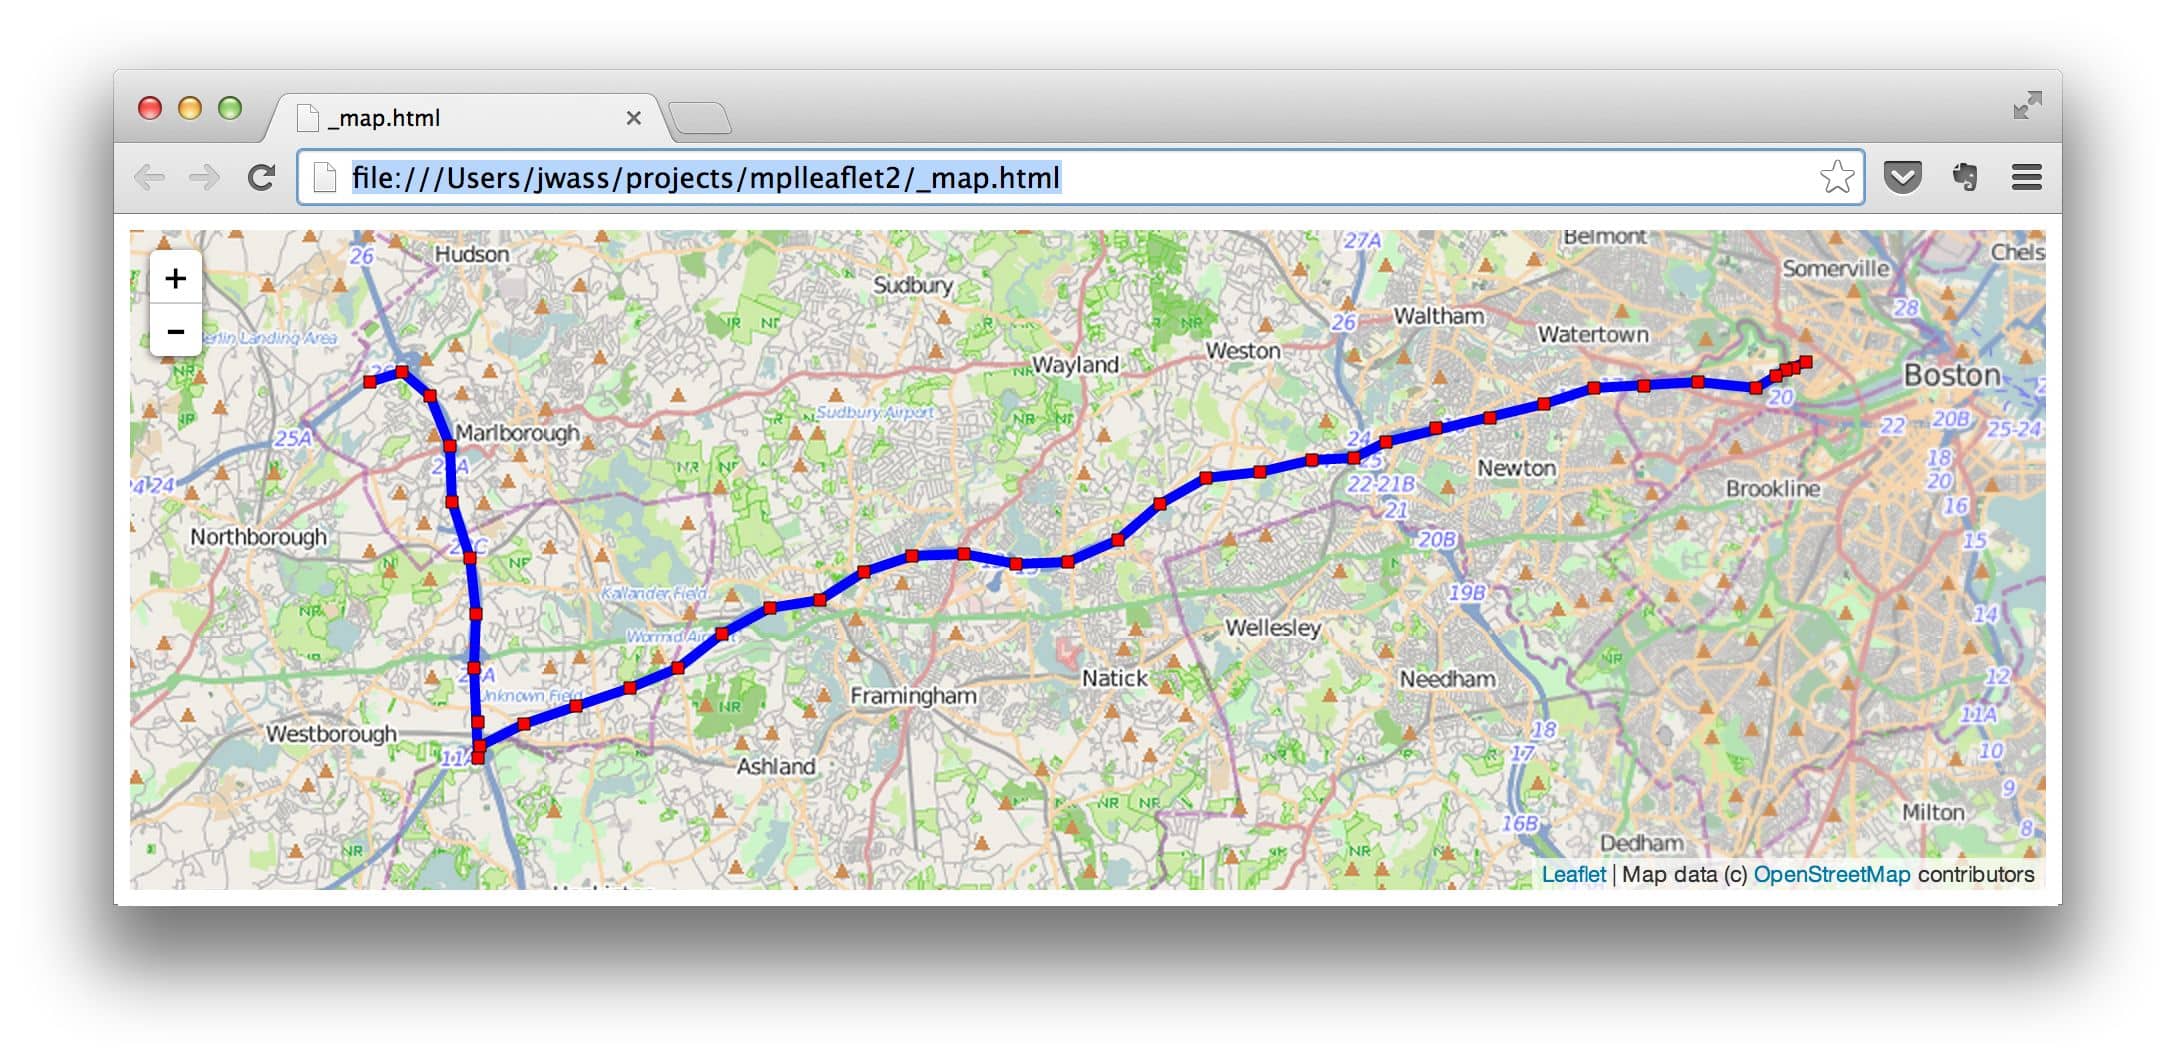
Python matplotlib Leaflet
Mplleaflet converts a matplotlib plot into a webpage containing a pannable, zoomable Leaflet map. It can also embed Leaflet slippy maps in an IPython notebook without having to write any Javascript or HTML.

Python
Welcome to Toyplot, the kid-sized plotting toolkit for Python with grownup-sized goals:

JavaScript/JS Leaflet
Developed by WanderGIS, leaflet-echarts3 is a plugin for leaflet to load Baidu echarts3 maps and make cross-platform visualization easier; English documentation unavailable.
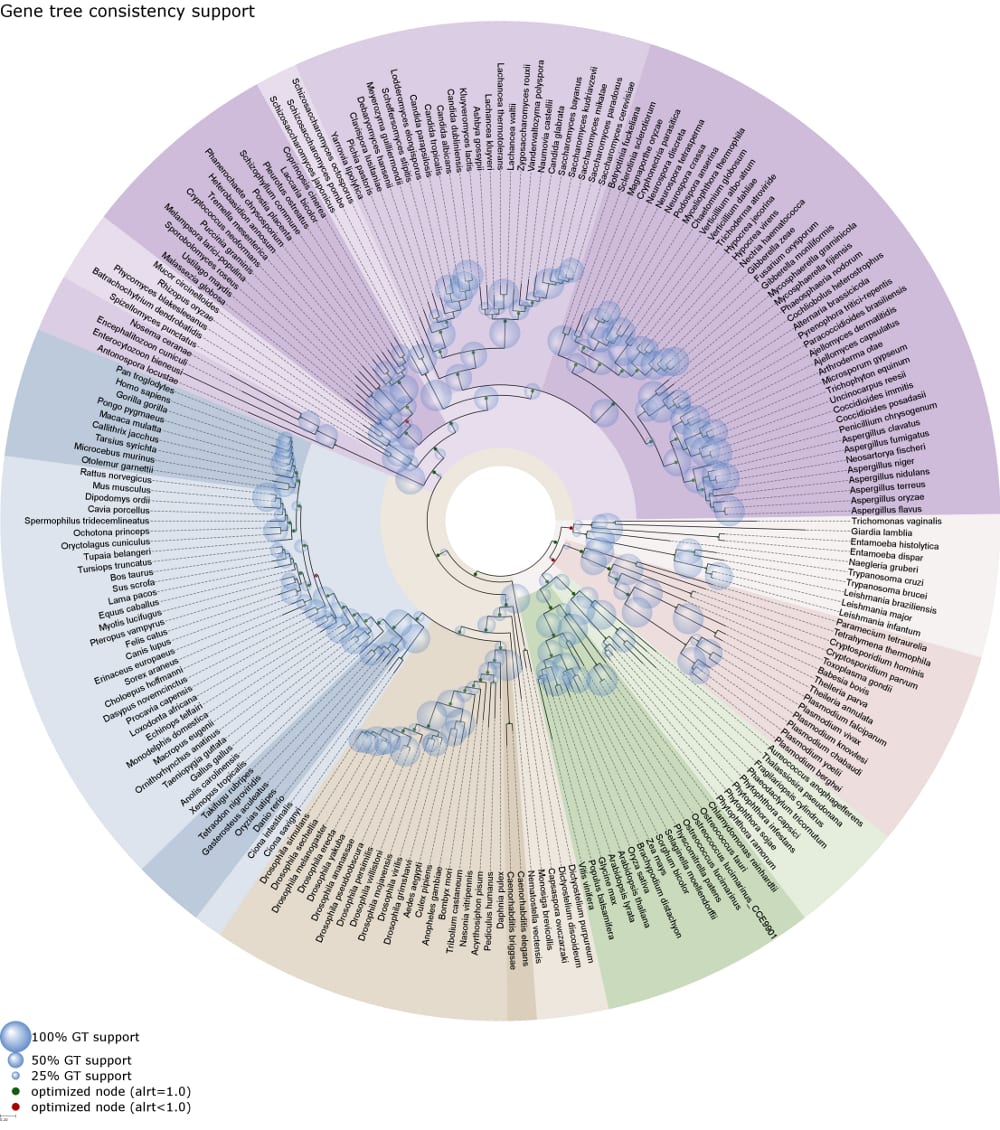
Python bio phylogenetic trees random
ETE (Environment for Tree Exploration) is a Python programming toolkit that assists in the automated manipulation, clustering, analysis, and visualization of phylogenetic trees.
JavaScript/JS GL scientific bigdata
Superconductor is a web framework for creating data visualizations that scale to real-time interactions with up to 1,000,000 data points. It compiles to WebCL, WebGL, and web workers to unleash the power of parallel hardware for fast and cross-platform data visualization.

JavaScript/JS minified security easy microinteractions µ
A lightweight plugin to simulate android like pattern lock mechanism for your hybrid app or for a website. It's easy to configure and style so you can have different type of pattern lock according to your needs.
JavaScript/JS D3 jQuery
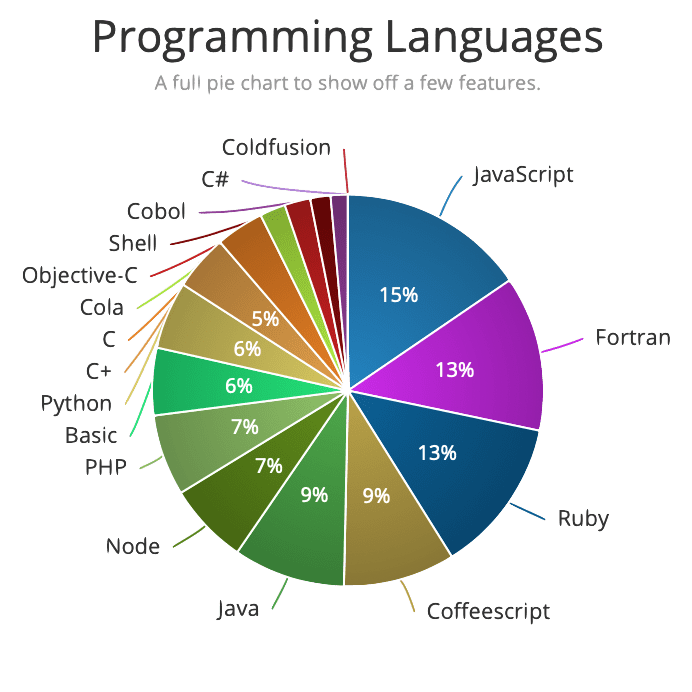
d3pie is a highly configurable, re-usable script built on d3.js and jQuery for creating clear, attractive pie charts. It's free, open source, and the source code for the website and script are found right here on github. Visit d3pie.org to learn about the script and create your own pie charts via the online generation tool. This section is to document the codebase only. The website contains the script download links, standalone examples, full documentation and lots of demo pies for you to play around with. That's the place to start!

JavaScript/JS CSV
Datamaps.co is a free platform for creating visualizations with data maps. It allows you to upload CSV file with region data, and fully customize your map's appearance. Your Map can be saved as PNG or SVG.

Python terminal
Simple text mode diagrams using UTF-8 drawing characters and a wide spectrum of colors in Python; generates axial graphs, horizontal and vertical bar graphs, as well as text graphics.
JavaScript/JS easy system dynamics explainables explorables scenario-based
Consider the paintbrush: simple enough for a child, complex enough for an Old Master. Joy.js is a tool for making visualizations and scenario-based simulations tools like that.

JavaScript/JS Vega statistics statistical
PoleStar is Tableau-style User Interface for visual analysis, building on top of Vega-Lite.

JavaScript/JS easy
Polychart2.js is an easy-to-use yet powerful JavaScript graphing library. It takes many ideas from the Grammar of Graphics and the R library ggplot2, and adds interactive elements to take full advantage of the web.

JavaScript/JS Python
Visualize Python code execution (line-by-line) in Jupyter Notebook cells. Inspired by Online Python Tutor.

JavaScript/JS D3 minified easy
D3xter.js Simple and powerful syntax to make common charts with minimal code. Highly flexible plotting for deep customization. Sensible defaults but easy to configure as needed. Easily extendable via familiar D3.js syntax.

JavaScript/JS D3 Gantt
Gantt chart library using D3.js. Gantt chart library using D3.js.

JavaScript/JS transport roads
Traffic pattern simulator using intelligent driver model and MOBIL lane-changing model; written in CoffeeScript and HTML5. In future releases, traffic light optimizer/traffic jam avoidance will be added.

JavaScript/JS Python D3 security
netgrafio visualizes network data in an OOP-friendly manner using D3.js. Includes a network analysis module, nmap results visualization, and extensive code documentation.

R-project bio phylogenetic trees ggplot2
The ggtree package builds on ggplot2. As a key part of the Bioconductor project, it is designed for not only viewing phylogenetic trees but also for displaying annotation data on the tree.

R-project
timevis lets you create rich and fully interactive timeline visualizations in R. Timelines can be included in Shiny apps and R markdown documents, or viewed from the R console and RStudio Viewer. timevis includes an extensive API to manipulate a timeline after creation, and supports getting data out of the visualization into R. This package is based on the vis.js Timeline module and the htmlwidgets R package.

JavaScript/JS jQuery microinteractions µ
Flexdatalist is (another) jQuery autocomplete plugin with support for datalist Check the documentation page to see the plugin in action.


R-project ML manifold map
An implementation of the largeVis algorithm for visualizing large, high-dimensional datasets, for R

JavaScript/JS GitHub software version control source code
Provides an at-a-glance overview of GitHub repository structures. Finer details can be explored via zooming and tooltips. GitHub Visualizer makes exploring complex projects a breeze.
Python cryptocurrency financial
CryptoTracker makes it easy for you to collect, store, analyze, visualize, and monitor cryptocurrency data, including Price, Bid/Ask Spreads, Size, and Volume.


Java SE
The Visual Understanding Environment (VUE) is an Open Source project based at Tufts University. The VUE project is focused on creating flexible tools for managing and integrating digital resources in support of teaching, learning and research. VUE provides a flexible visual environment for structuring, presenting, and sharing digital information.

ActionScript Flash
Flare is an ActionScript library for creating visualizations that run in the Adobe Flash Player. From basic charts and graphs to complex interactive graphics, the toolkit supports data management, visual encoding, animation, and interaction techniques.

TypeScript
A pluggable layout and graphics system aimed at powering desktop publishing as well as storm-react-diagrams.
R-project
Now available on CRAN, visNetwork is an R package for interactive network visualization using the vis.js Javascript library. User feedback and bug reports are welcome on GitHub.

JavaScript/JS jQuery
TextTailor.js is a jQuery plugin designed to adjust text to fill the height of the parent element or append an ellipse it if it doesn't fit; parent elements must have fixed or percentage heights.

R-project JavaScript/JS word clouds wordclouds
R-based wordcloud visualization; relies on wordcloud2.js with knitr and shiny support; includes star, oval, and words-within-words shapes, as well as tooltip functionality; can handle Chinese.

JavaScript/JS TopoJSON D3 vote voting elections electoral
This is a JavaScript implementation of an algoritm to construct continuous area cartograms. It relies heavily on D3.js for rendering and TopoJSON for writing and reading topological JSON geodata.

JavaScript/JS lightbox
nanogallery2 is a must have gallery and lightbox. Strengths of nanogallery2 include rich UI interactions, multiple responsive layouts, swipe and zoom gestures, multi-level albums, an HTML page generator and limitless options. Setup and use are simple. The documentation includes tutorials, samples and ready to use HTML pages.

JavaScript/JS typography microinteractions µ
A jQuery plugin to help you create optimally sized paragraphs for maximum readability, readable conveniently sets line breaks between the 45th and 75th character of every paragraph.

JavaScript/JS D3
A framework for creating reusable charts with D3.js, written in ES6. KotoJS is inspired by another reusable charting framework maintained by the Miso Project called d3.chart.
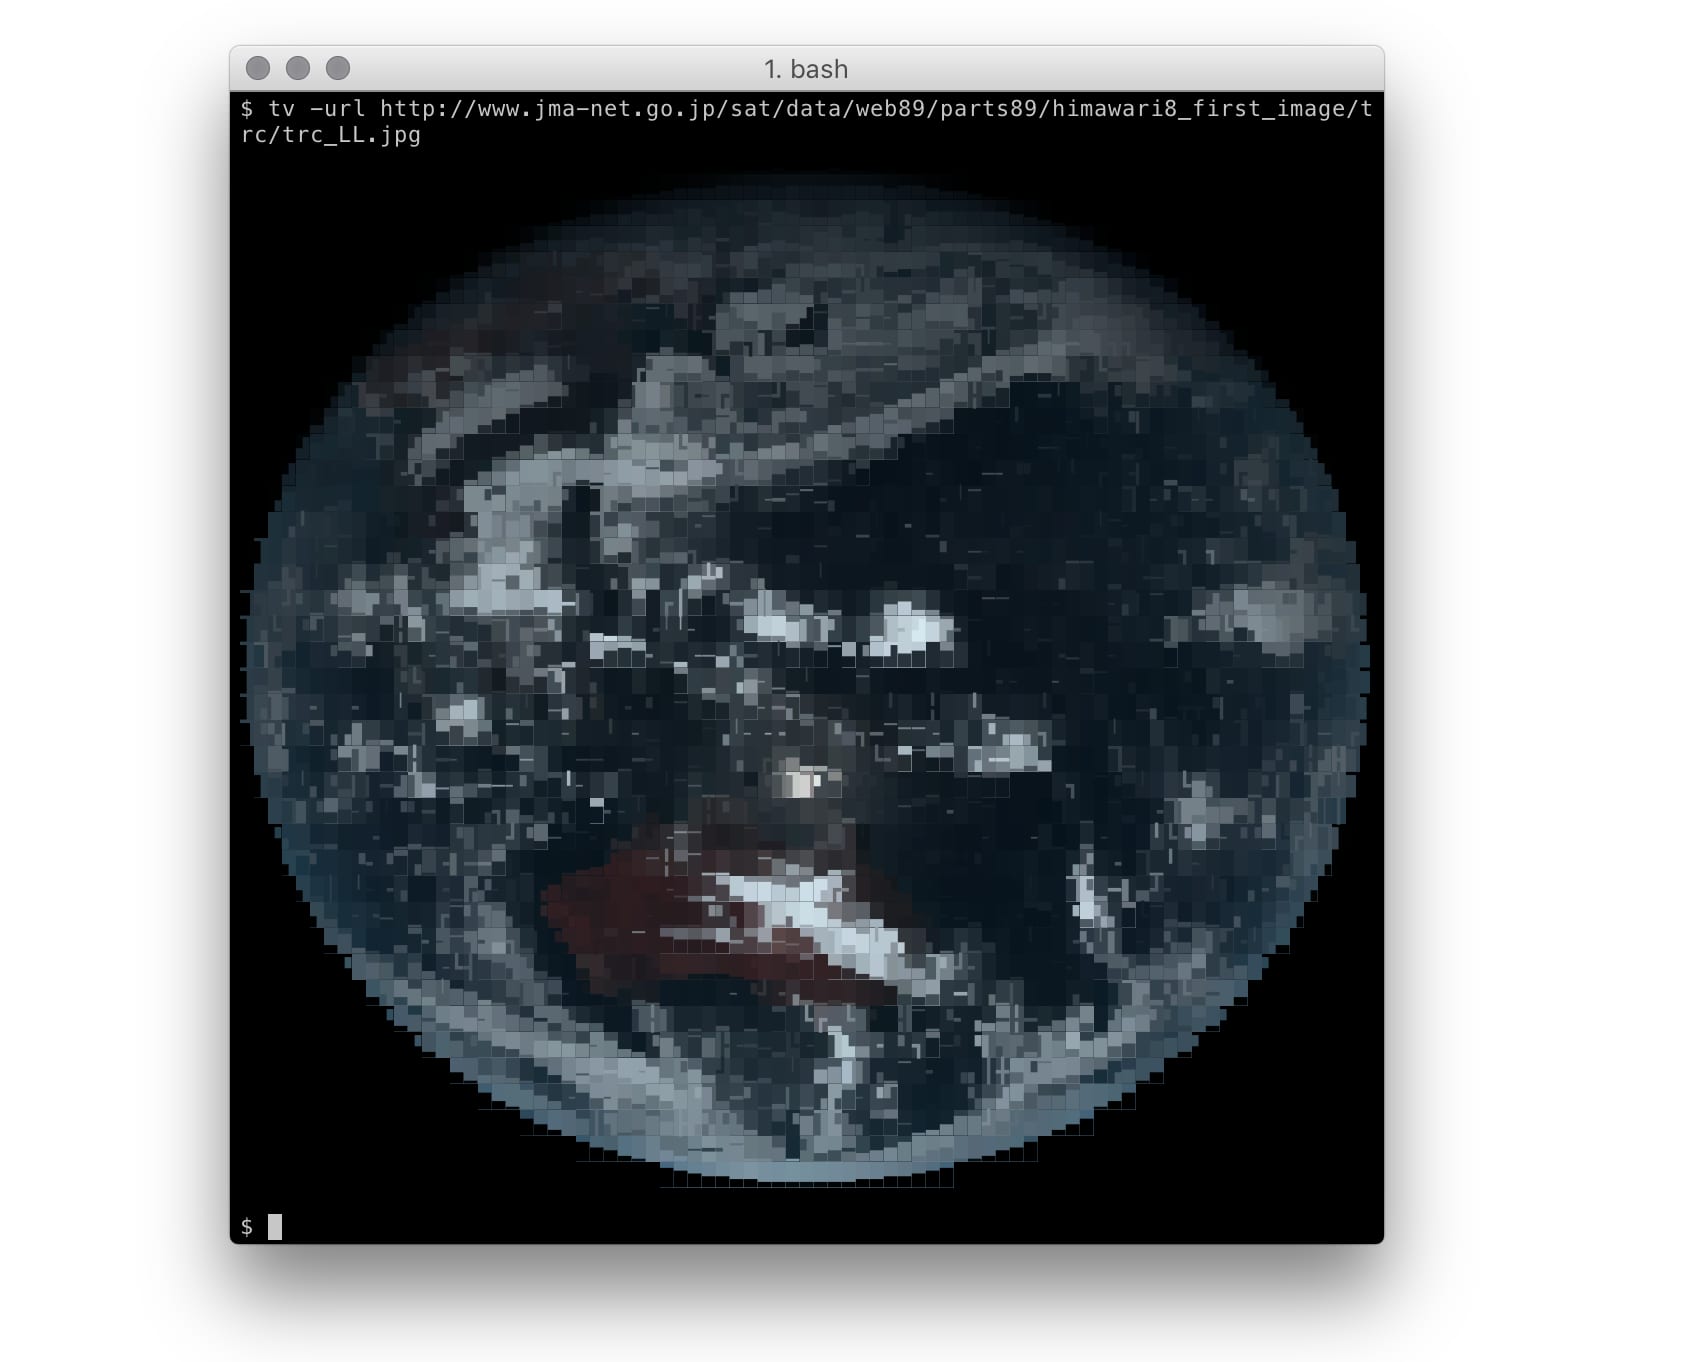
Python space terminal
tv ("textview") is a small tool to quickly view high-resolution multi-band imagery directly in the terminal. It was designed to work with (very large) satellite imagery data over low-bandwidth connections.

Python D3
Brunel defines a highly succinct and novel language that defines interactive data visualizations based on tabular data. The language is well suited for both data scientists and more aggressive business users. The system interprets the language and produces visualizations using the user's choice of existing lower-level visualization technologies typically used by application engineers such as RAVE or D3. It can operate stand-alone and integrated into Jupyter (IPython) notebooks with further integrations as well as other low-level rendering support depending on the desires of the community.
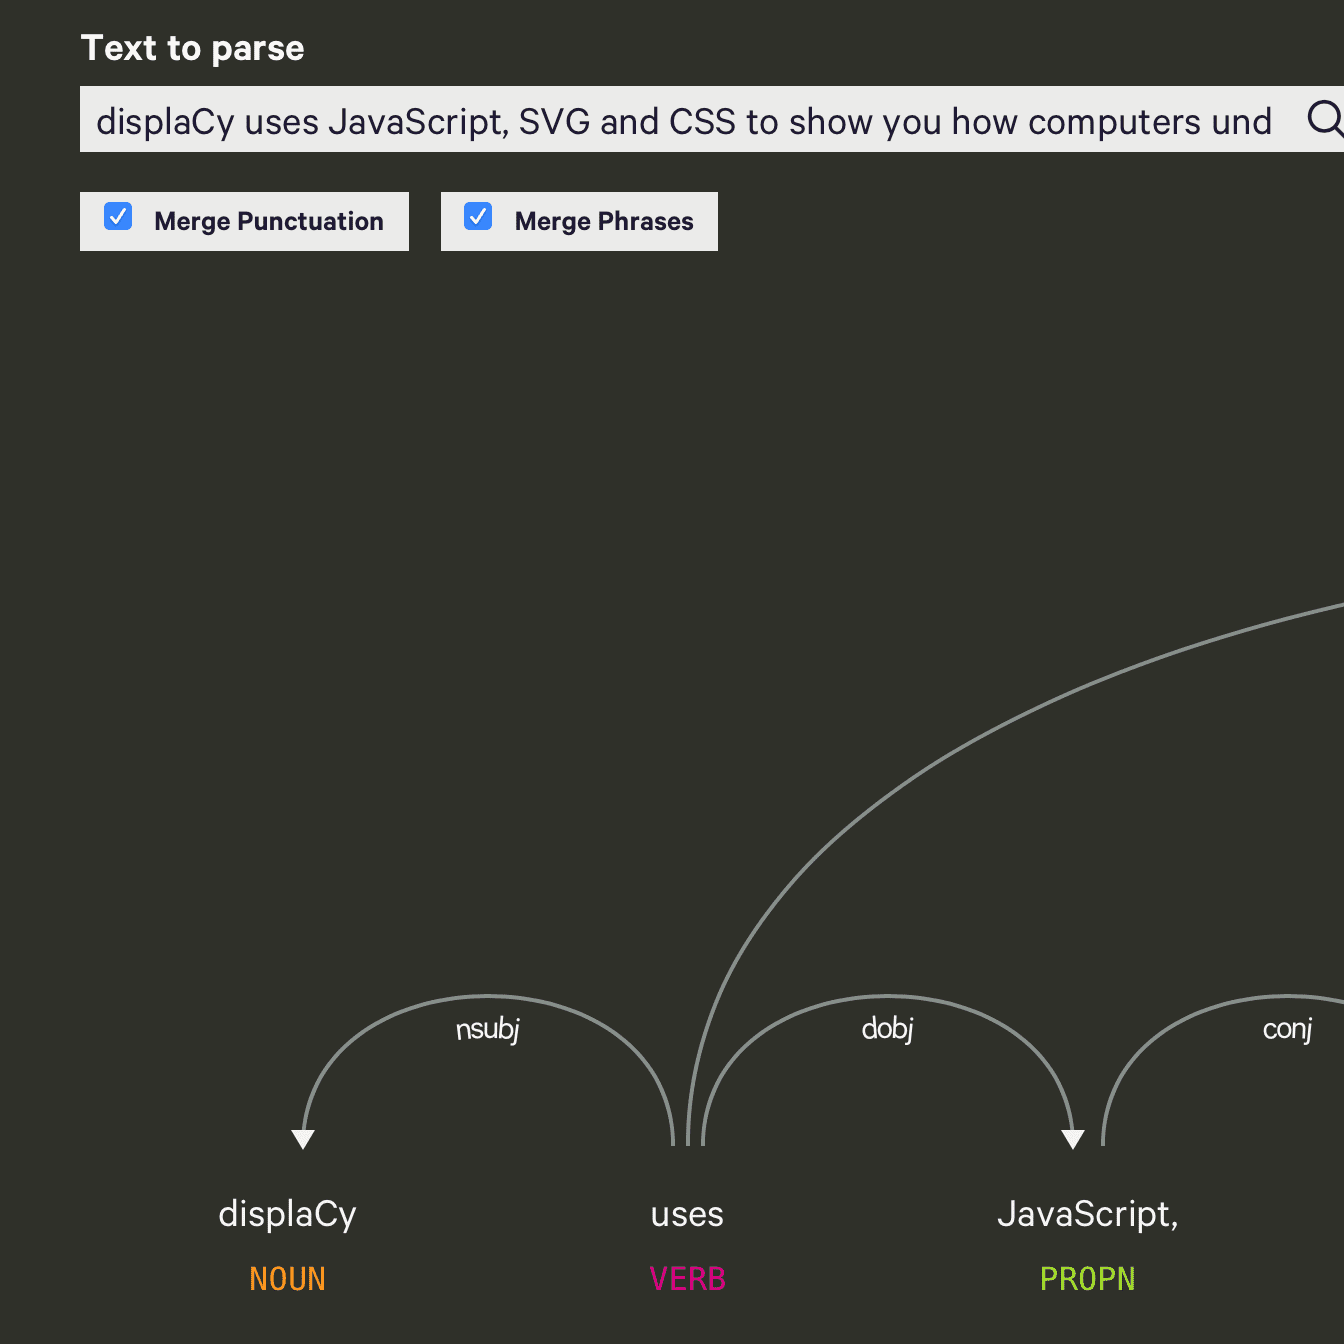
JavaScript/JS natural language processing NLP treebank
DisplaCy.js is an open-source natural language processing (NLP) visualiser for the modern Web; allows you to pass in one or more Doc objects and you check your model's predictions.

JavaScript/JS minified jQuery microinteractions µ
A tiny (~3kb) jQuery plugin for crossfading images as you scroll down a page

JavaScript/JS 3dTiles Three.js WebGL GeoJSON Vector Tiles GPX tilesets tilemaps
iTowns is a Three.js-based framework written in Javascript/WebGL for visualizing 3D geospatial data. It can connect to WMS/WMTS/TMS servers including elevation data.

Python animation
PlotDevice is a Macintosh application used for computational graphic design. It provides an interactive Python environment where you can create two-dimensional graphics and output them in a variety of vector, bitmap, and animation formats. It is meant both as a sketch environment for exploring generative design and as a general purpose graphics library for use in external Python programs. PlotDevice scripts can create images from simple geometric primitives, text, and external vector or bitmap images. Drawing commands provide a thin abstraction over Mac OS X's Quartz graphics engine, providing high-quality rendering of 2D imagery and powerful compositing operations.


Python ternary
Veusz is a 2D and 3D scientific plotting package. It is designed to produce publication-ready PDF or SVG output. Graphs are built-up by combining plotting widgets. The user interface aims to be simple, consistent and powerful. Veusz provides GUI, Python module, command line, scripting, DBUS and SAMP interfaces to its plotting facilities. It also allows for manipulation and editing of datasets. Data can be captured from external sources such as Internet sockets or other programs.

JavaScript/JS convert TSV CSV geoJSON
Converts CSV and TSV files into derive a GeoJSON FeatureCollection objects suitable for online mapping. Delimiter can be ',' for CSV or '\t' for TSV; can also handle '|' and other delimiters.

JavaScript/JS tilesets tilemaps slippymaps
d3.carto is a library for creating layer-based maps using D3.js. It allows you to easily make tiled "slippy" maps as well as vector maps that take advantage of D3's geospatial functionality.

JavaScript/JS minified easy microinteractions µ
A JavaScript library to make navigation menus highlight the item based on currently in view section. No dependencies, easy to use, lightweight and fast.

Ruby Docker security
Network security visualization tool with a focus on red team/blue team requirements for pentesting, vulnerability assessment, and targeting. Docker and Docker Compose required.

JavaScript/JS D3
Simple, robust, extensible JavaScript charting library built using d3 designed to help developers embed, build charts in less than couple of minutes.

Go terminal Shell
termeter can visualize data in the terminal. Data can be passed by pipe or file.

JavaScript/JS software version control source code
Generate a side-by-side view of your comments and code. Works on JavaScript files, CSS, and other similar languages.

Java SE
Created in 2003, JUNG, the Java Universal Network/Graph Framework, provides a common extensible language for modeling, analyzing, and visualizing graph/network data.

JavaScript/JS D3
d3-funnel is an extensible, open-source JavaScript library for rendering funnel charts using the D3.js library. d3-funnel is focused on providing practical and visually appealing funnels through a variety of customization options. Check out the examples page to get a showcasing of the several possible options.


Java SE UML DSL
UML Designer provides a diverse range of common diagrams to work with UML 2.5 models; can help transition from legacy UML models to domain specific language (DSL) modeling.

JavaScript/JS Kubernetes Docker security
SPEKT8 is a new visualization tool for Kubernetes clusters that automatically builds logical topologies for SRE and Ops teams to monitor your application infrastructure and microservices.

Python matplotlib Bokeh Cartopy HoloViews
GeoViews is a Python library that makes it easy to explore and visualize geographical, meteorological, and oceanographic datasets, such as those used in weather, climate, and remote sensing research.

JavaScript/JS D3 animations
Visual sedimentation is a javascript visualizations library for streaming data, inspired by the process of physical sedimentation. This process is the result of objects falling due to gravity forces, that aggregate into compact layers over time. The process is well understood since our environment is shaped by sedimentation: mountains, hills or rivers are the visible result of this long process.

C++
GeoDa is built on several open source libraries. It is designed to implement techniques for exploratory spatial data analysis (ESDA) and spatial autocorrelation statistics on lattice data (points and polygons).
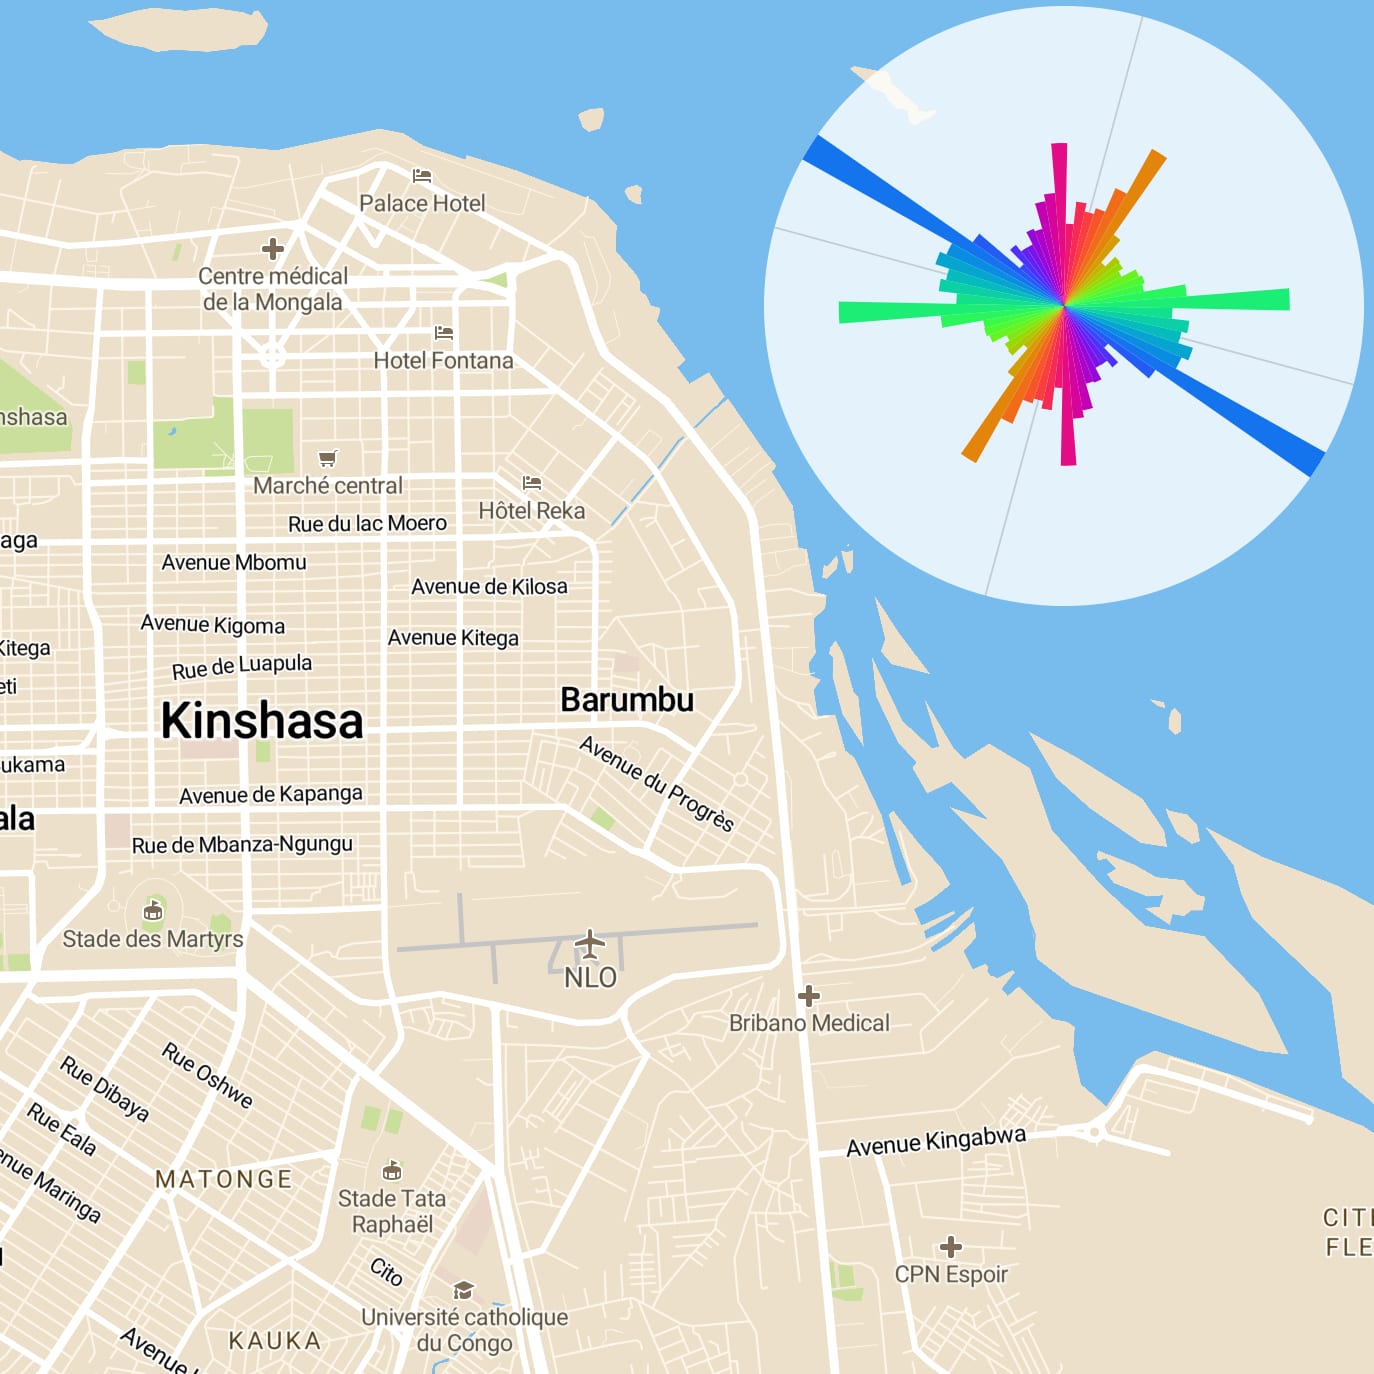
JavaScript/JS roads transport visibility
Visualizes road orientations in different locations. Divides 360° into 64 bins and generates polar charts of road segments orientations. Explore the map to see the overall traffic plan for your city!

JavaScript/JS D3
A tool to create sketchy backgrounds, shapes and lines. The library was inspired by Handy by Jo Wood et al. The circle strokes use code from http://codepen.io/spencerthayer/pen/nhjwu by Spencer Thayer. The library can draw rectangles and circles.

JavaScript/JS WebGL brain neurology scientific bio
BrainBrowser is a JavaScript library allowing for web-based, 2D and 3D visualization of neurological data (including both surface data and volumetric data).

JavaScript/JS D3 easy SVG 0 zero
Chart Tool is a platform for creating beautiful charts in under a minute. Designed to fit the needs of a fast-paced mobile and print newsroom, Chart Tool generates responsive interactive charts for the web, JPGs and PNGs for social media and PDFs for print. The first version of Chart Tool launched in The Globe and Mail's newsroom in spring 2015. In under a year, reporters and editors have created more than 2000 charts using the tool. The philosophy behind it was simple: it should be easy for anyone in the newsroom to create a great chart that just works — for every platform.

0 Zero CSV bias munging wrangling fingerprinting cleaning dimensionality preparation
CSV Fingerprint visualizes CSV files to help debug formatting issues. Each cell is colored according to its type: yellow for strings, blue for integers, purple for decimals and gray for empty values.

Python electric grid bulk power systems utility utilities networks
Python for Power System Analysis is a free software toolbox for simulating modern electric grids/bulk power systems, including data for unit commitment, variable wind/solar generation, and storage.

Python
Pycel is a small python library that can translate an Excel spreadsheet into executable python code which can be run independently of Excel. The python code is based on a graph and uses caching & lazy evaluation to ensure (relatively) fast execution. The graph can be exported and analyzed using tools like Gephi. See the contained example for an illustration.

JavaScript/JS timelines JSON KML GeoRSS OpenLayers
Timemap.js is a Javascript library to help use online maps, including Google, OpenLayers, and Bing, with a SIMILE timeline. The library allows you to load one or more datasets in JSON, KML, or GeoRSS onto both a map and a timeline simultaneously. By default, only items in the visible range of the timeline are displayed on the map.

Python scientific
Chaco is a Python package for building interactive and custom 2-D plots and visualizations. Chaco facilitates writing plotting applications at all levels of complexity, from simple scripts with hard-coded data to large plotting programs with complex data interrelationships and a multitude of interactive tools. While Chaco generates attractive static plots for publication and presentation, it also works well for interactive data visualization and exploration. Chaco is part of the Enthought Tool Suite.

Python ML XAI bias No License
PyTorch implementation of Interpretable Explanations of Black Boxes by Meaningful Perturbation

JavaScript/JS D3 bio molecular pv
pv is a WebGL-based protein viewer whose goal is to once-for-all end the reign of Java applets on websites that require visualisation of protein structures. It's not you Java, it's all the annoying security popups and slow loading times. pv implements all major render modes that you would expect, and supports custom color schemes. Because there is nothing worse than an unresponsive website, pv has been implemented with maximum performance in mind. Even very large macromolecules can be visualised at interactive framerates.

JavaScript/JS D3 Github software version control source code
This tool visualizes software package dependencies using an interactive disc. Each disc section represents a dependency, and links between arcs materialize these dependencies.

JavaScript/JS counter countdown
Tick is a JavaScript plugin that makes visualizing dynamically changing numbers a breeze.

JavaScript/JS iOS
InfoViz is an information visualization library based on Raphaël. Raphaël currently supports Firefox 3.0+, Safari 3.0+, Chrome 5.0+, Opera 9.5+ and Internet Explorer 6.0+. By the way, InfoViz supports iOS devices, include the new iPad with retina display. You may overwrite almost every visual style in InfoViz charts. There's few magic numbers in InfoViz code, when we need a number, we add an option for you to overwrite. Transparent background? Sure! Reverse color? Sure! Black and white? Sure! See Configurations to find out how.

JavaScript/JS Sankey
A framework for building visual data exploration tools [bubble, map, line, bar, sankey, donut]

JavaScript/JS D3
dTree is a D3.js-based open-source graph library for visualizing family trees with multiple parents. It has a companion platform, Treehouse, for easy demoing and hosting of dTree graphs.

JavaScript/JS
JavaScript Charts The developer's solution for visualizing data in web apps. ZingChart is dependency free and pure JavaScript.

JavaScript/JS jQuery
jqPlot is a plotting and charting plugin for the jQuery Javascript framework. jqPlot produces beautiful line, bar and pie charts with many features.

JavaScript/JS
An attempt to port the spirit of the Processing visualization language to Adobe Indesign.

Python No License
Deep Replay is a package designed to allow you to replay in a visual fashion the training process of a Deep Learning model in Keras, as I have done in "Hyper-parameter in Action"

R-project survival hazard rates statistics statistical
The survminer R package provides functions for facilitating survival analysis and visualization. The main functions in the package include Survival Curves, Cox Models, and competing risks.
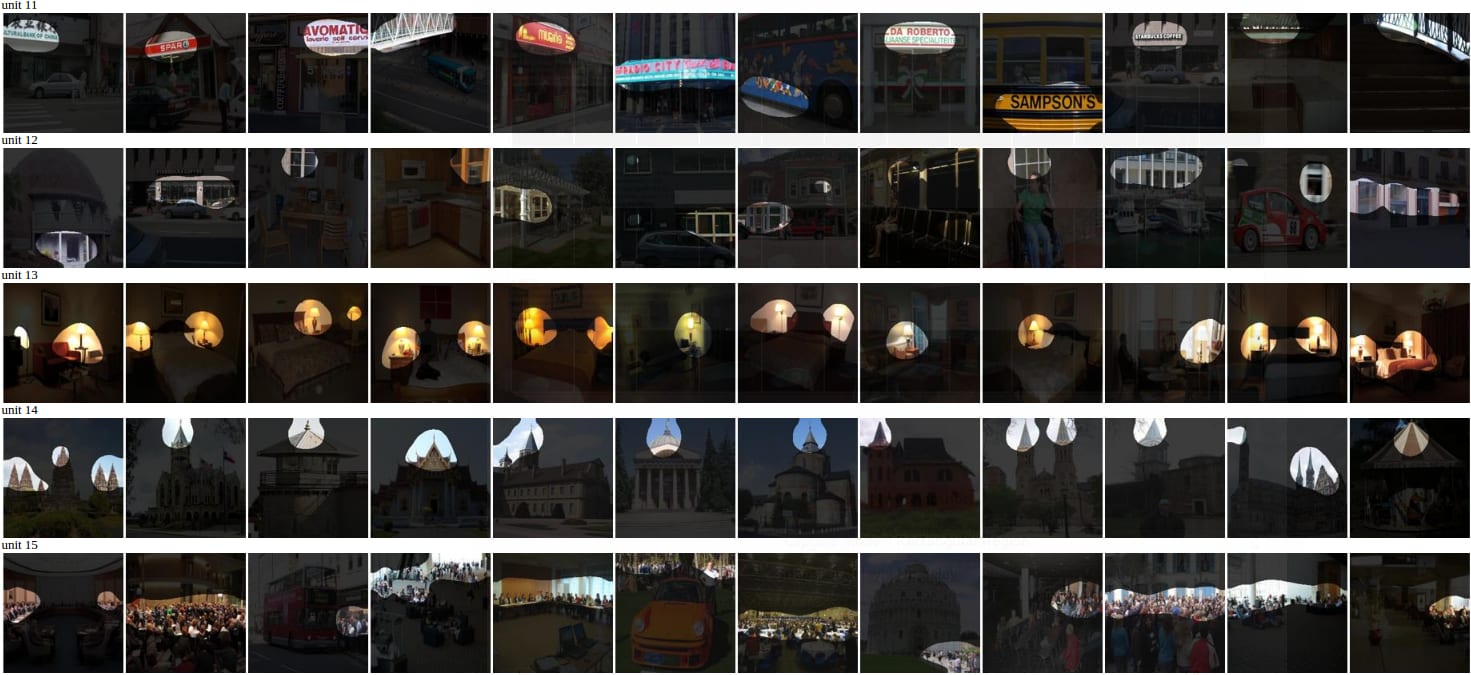
Python machine learning ML neural network ANN CNN deep learning Caffe pyTorch
This tool visualizes the units (or named as neuron or convolutional filters) inside deep CNN. You can use this toolkit with the naive caffe, with matcaffe and pycaffe compiled, or pyTorch.

JavaScript/JS
Data Visualization Library for http://keen.io , Demo: http://keen.github.io/keen-dataviz.js/

JavaScript/JS Kubernetes Docker
This is a simple visualizer for use with the Kubernetes API. it expects that pods, replicationcontrollers, and services have a name label, and pods and their associated replication controller share the same name, and the pods in your cluster will have a uses label which contains a comma separated list of services that the pod uses.

Python easy unstructured statistics statiscal
yt is an open-source, permissively-licensed python package for analyzing and visualizing volumetric data. yt supports structured, variable-resolution meshes, unstructured meshes, and discrete or sampled data such as particles. Focused on driving physically-meaningful inquiry, yt has been applied in domains such as astrophysics, seismology, nuclear engineering, molecular dynamics, and oceanography. Composed of a friendly community of users and developers, we want to make it easy to use and develop — we'd love it if you got involved!

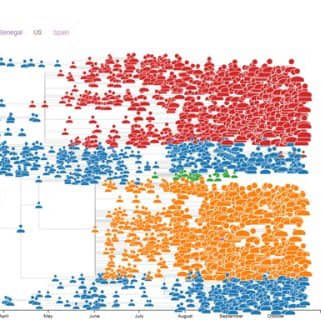
JavaScript/JS Python
Tangelo provides a flexible HTML5 web server architecture that cleanly separates your web applications (pure JavaScript, HTML, and CSS) and web services (pure Python). This software is bundled with some great tools to get you started. (JavaScript/Python)
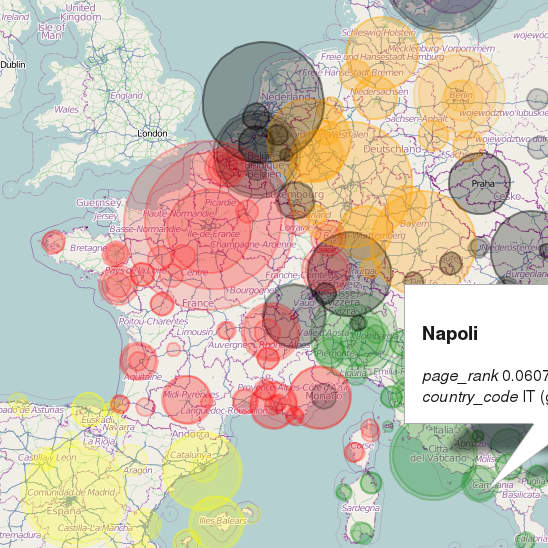
JavaScript/JS Python
After loading data, you can visually query keys (find this key, or find keys with this property), fuzzy string distance (find places roughly named like this), and phonetics (find cities sounding like this).

JavaScript/JS maps timelines chronology spatiotemporal digital humanities culture cultural annotate annotations literature literary culture cultural random
Timeline Storyteller is an open-source expressive visual storytelling environment for presenting timelines in the browser or in Microsoft Power BI. Use it to present different aspects of timeline data using a palette of timeline representations, scales, and layouts, as well as controls for filtering, highlighting, and annotation.

R-project Bayesian Markov Chain Monte Carlo Methods statistics statistical
bayesplot is an R package providing an extensive library of plotting functions for use after fitting Bayesian models (typically with MCMC). Currently bayesplot offers a variety of plots of posterior draws, visual MCMC diagnostics, as well as graphical posterior predictive checking. Additional functionality (e.g. for forecasting/out-of-sample prediction and other inference-related tasks) will be added in future releases. The plots created by bayesplot are ggplot objects, which means that after a plot is created it can be further customized using the various functions for modifying ggplot objects provided by the ggplot2 package.


C Julia Python GL statistics statistical scientific bigdata
GR is a universal framework for cross-platform visualization applications. It offers developers a compact, portable and consistent graphics library for their programs. Applications range from publication quality 2D graphs to the representation of complex 3D scenes.

C++ Cuda Typescript Python brain neurology scientific bio
Brayns is a minimalistic visualizer that can perform hardware accelerated ray-traced rendering of neurons.

Java SE time series statistics statistical
Mirador is a tool for visual exploration of complex datasets. It enables users to discover correlation patterns and derive new hypotheses from the data.

C++ scientific bio
Tomviz allows users to analyze and visualize 3D tomographic data featuring editable Python scripts and a complete pipeline capable of processing data from alignment, reconstruction, and segmentation.

JavaScript/JS small multiple
Chiasm is a browser based runtime environment and component architecture for interactive data visualizations. It allows plugins for data access, data transformation, and interactive visualization to be loaded and configured dynamically.
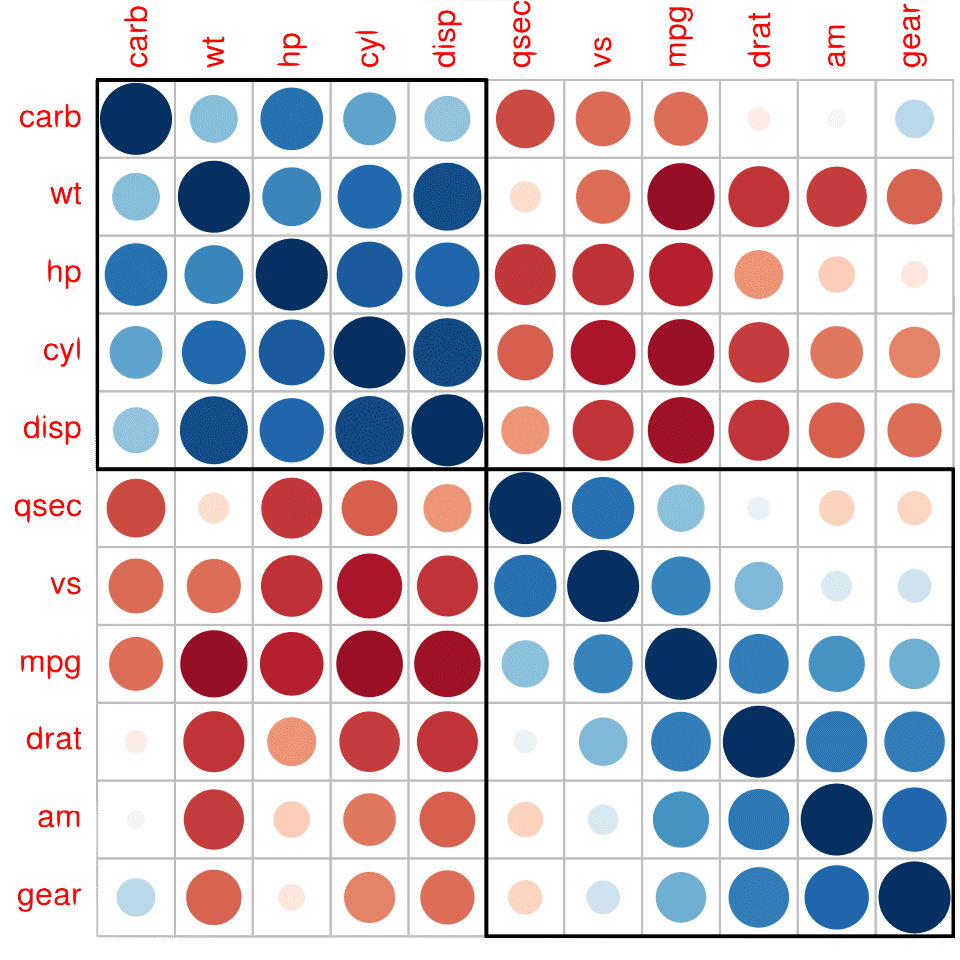
R-project correlation matrix random small multiple
A graphical display of a correlation matrix or general matrix, as well as confidence intervals. It also contains some algorithms to do matrix reordering. In addition, corrplot is good at details, including choosing color, text labels, color labels, layout, etc.

JavaScript/JS D3 annotate annotations simulated annealing microinteractions µ
A D3-based automatic label placement plugin using simulated annealing across leader lines and anchor points; easily incorporates into existing D3.js code with syntax mirroring other D3 layouts.
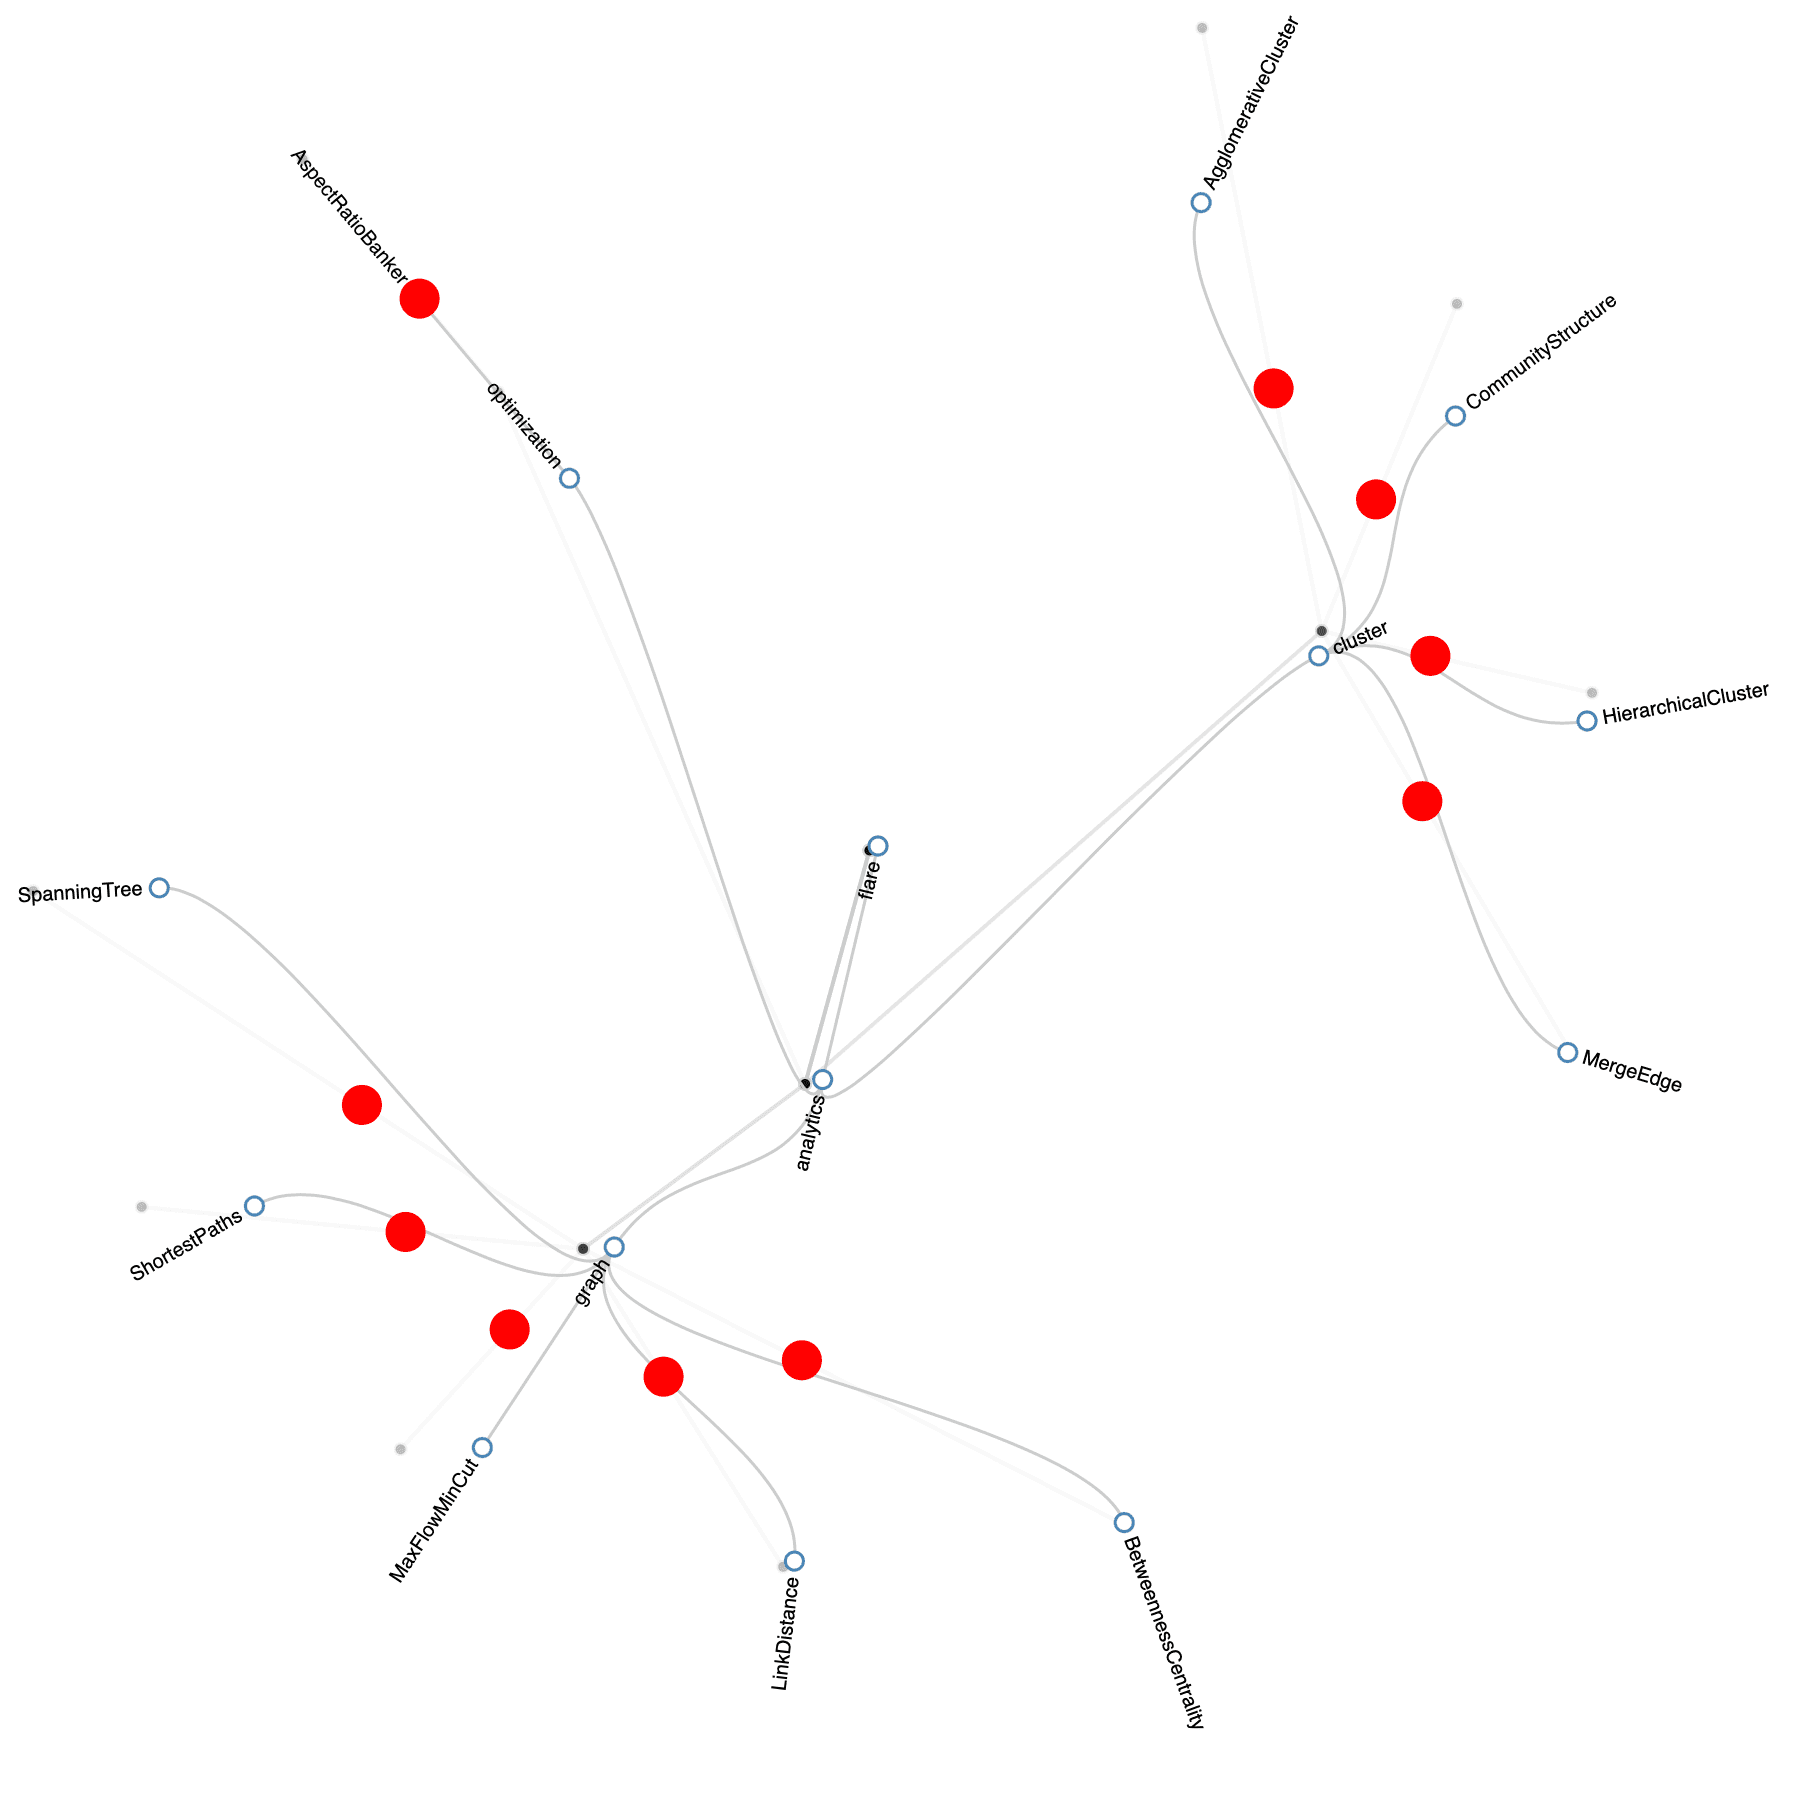
JavaScript/JS D3
dragit is an extension to the D3.js library to enable the direct manipulation of SVG data visualization. It is designed to be seamlessly included in an existing D3 visualization. It is also designed to be highly customizable and extensible.


JavaScript/JS easy statistics statiscal
Trelliscope is a scalable, flexible, interactive approach to visualizing data in R; with functions provided from dplyr (via summarise()) and ggplot2 (via facet_trelliscope()).
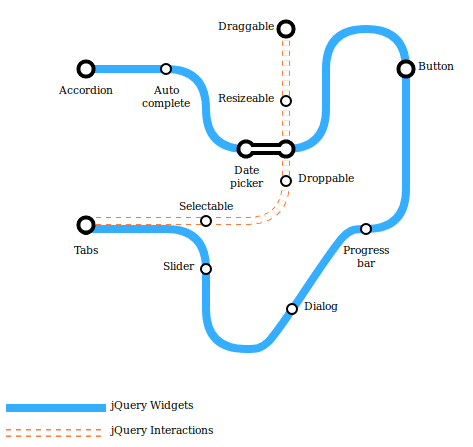
JavaScript/JS subways commuter rail mass transit transport
A jQuery plugin to render data as a subway map. Outer <div> elements determine placement/background, <ul> elements draw each line desired on the map, and one or more <li> tags provide markers.

JavaScript/JS utilities
Create SVG patterns programmatically to visualize data, to help color-blind people and because it looks nice.

JavaScript/JS
Built on top of Linkurious.js, the Quark visualization framework allows you to display your data in form of nodes and edges with in-browser runtime and multiple custom features.

JavaScript/JS force directed source code
In allnpmviz3d, each dot represents an npm package, and each connection means there is a dependency between two packages. The position of each package is determined by force based layout.

R-project
muxViz visualizes and analyzes interconnected multilayer networks. It works with any browser and provides access to many customizable graphic options for anlyzing multilayer data.

R-project ggplot2
ggnet2 plots network objects as ggplot2 objects. It accepts any object that can be coerced to the network class, including adjacency or incidence matrices, edge lists, or igraph objects.

R-project easy
factoextra is an R package that extracts and visualizse the output of exploratory multivariate data analyses, including: Principal Component Analysis (PCA), Multiple Correspondence Analysis (MCA), Factor Analysis of Mixed Data (FAMD), and other methods.

Python
hvPlot provides a high-level plotting API built on HoloViews and Bokeh that provides a general and consistent API for plotting data in multiple formats.

JavaScript/JS random explainables explorables scenario-based vote voting elections electoral
Visualizing voting results in the European Parliament. The results can be viewed sorted by seat, political group and age. Every dot represents a single vote – yes, no or abstention.

JavaScript/JS presentations
slideshow - write your slides / talks / presentations in plain text with markdown formatting conventions
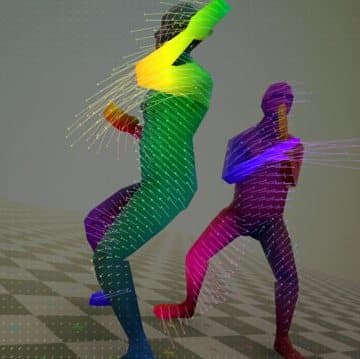
C Python utilities video
Vision is a utility image filter for Unity that visualizes frame information.

JavaScript/JS presentations microinteractions µ
DIY responsive image slideshow made with HTML5, CSS3, and JavaScript. Fully responsive, option for auto-advancing slides, or manually advancing by user, multiple slideshows per-page, supports arrow-key navigation, full-screen toggle using HTML5 fullscreen api, swipe events supported on touch devices (requires hammer.js), written in vanilla JS--this means no jQuery dependency.

Python NumPy matplotlib
Netgraph is a Python module for plotting weighted, directed graphs of medium size (10-100 nodes); it can also visualize unweighted, undirected graphs; uses NumPy and matplotlib.

JavaScript/JS sets
UpSet is an interactive, web based visualization technique designed to analyze set-based data. UpSet visualizes both, set intersections and their properties, and the items (elements) in the dataset. Please see the project website at http://vcg.github.io/upset/about for details about the technique, publications and videos.

JavaScript/JS WebGL bigdata
imMens is a web-based visualization system for large databases. It uses binned aggregation, advanced data decomposition methods, and hardware acceleration to produce interactive summary views.

JavaScript/JS jQuery microinteractions µ documentation
A tour/walkthrough plugin for developers. It includes limited automatic behavior, more like a 'toolkit' than some of the others out there.

Python security munging wrangling cleaning preparation I2
LeakScraper is an efficient set of tools to help penetration testers, security analysts, and redteamers process and visualize huge text files containing credentials in the context of OSINT.

Python
Python module to visualize a recursion as a tree with arguments and return values at each node. Provides a decorator to instrument target functions (as opposed to trace or debugger based approaches). Uses pygraphviz to render the graph.

Python machine learning ML neural network ANN CNN deep learning pyTorch
This tool visualizes convolutional neural network units in higher layers in PyTorch, drawing inspiration from the Lasagne examples, as well as the deep visualization toolbox.

Clojure REPL
vizard is a tiny client/server library meant to enable REPL-based data visualization in the browser.

Python No License machine learning ML neural network ANN CNN deep learning natural language processing NLP
HNATT is a deep neural network for document classification. It learns hierarchical hidden representations of documents at word, sentence, and document levels, using highlighting to show attention and weighting.
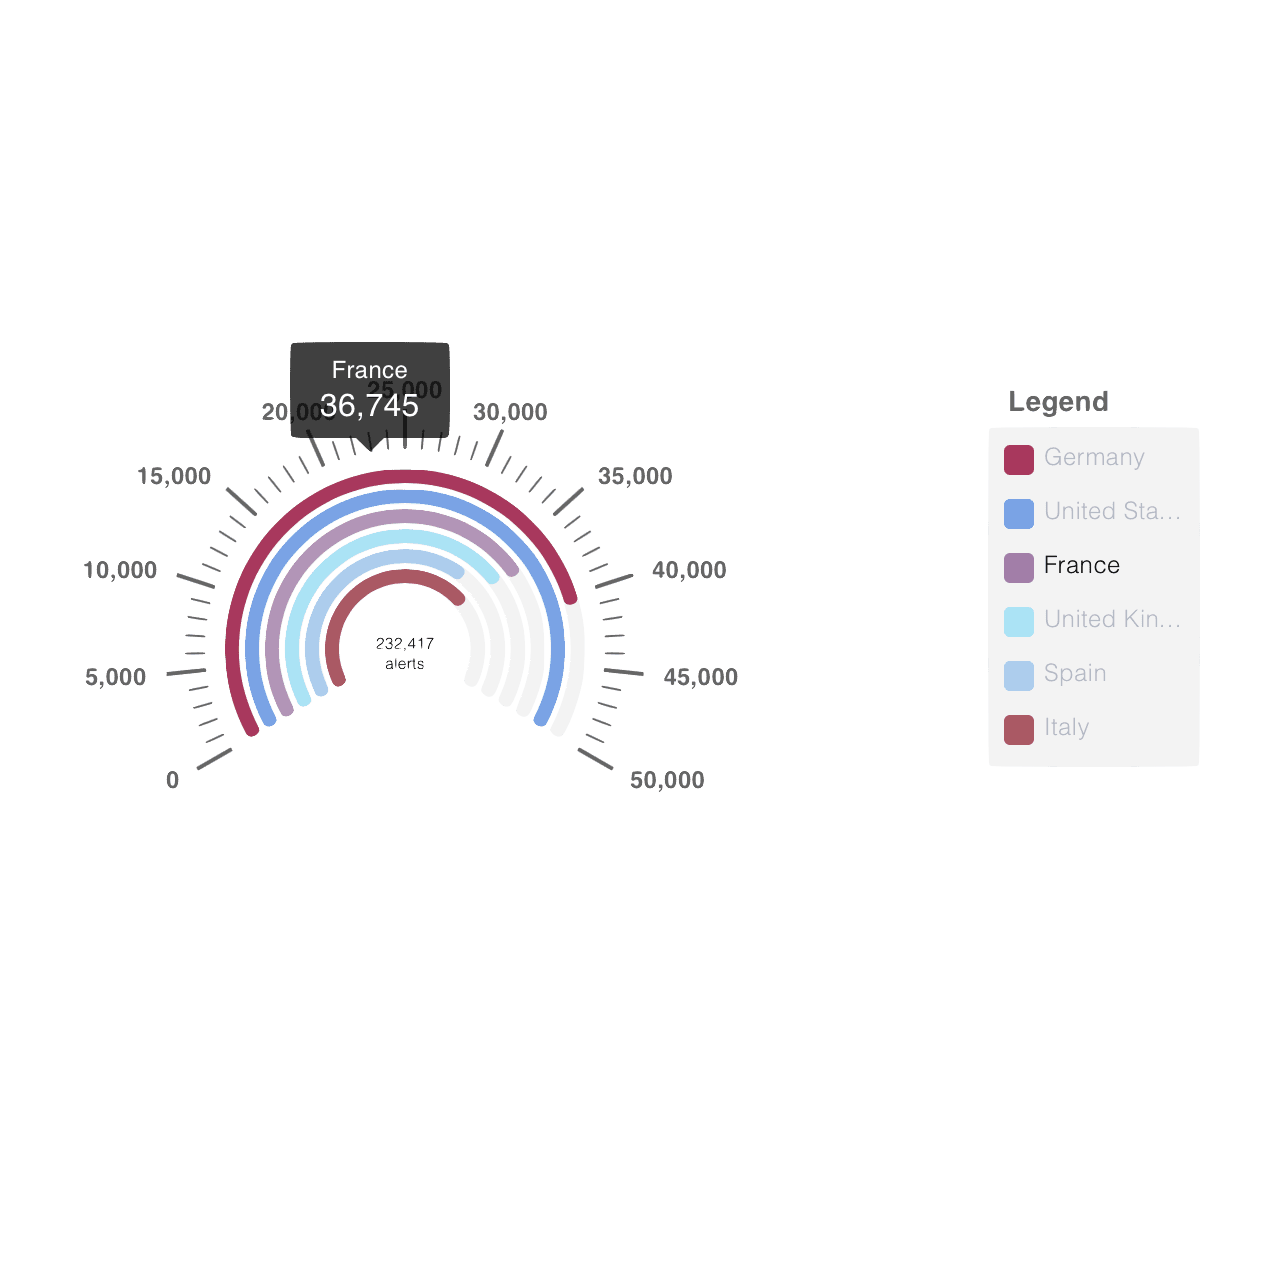
Typescript D3 AngularJS
A declarative charting framework for Angular2, NGX-charts is unique in that it does not merely wrap d3. Rather, it uses Angular to render and animate the SVG elements rapidly, while relying on d3 for math functions, scales, axis and shape generators, etc.

JavaScript/JS D3 Python
Clustergrammer is a web-based tool for visualizing high-dimensional data (e.g. a matrix) as an interactive and shareable hierarchically clustered heatmap.

JavaScript/JS D3 reverse engineer extract utility
The D3 Deconstructor is a Google Chrome extension for extracting data from D3.js visualizations. D3 binds data to DOM elements when building a visualization. Deconstructor extracts this data and the visual mark attributes (such as position, width, height, and color) for each element in a D3 visualization. Then, elements are grouped by the type of data they are bound to.

JavaScript/JS
Exhibit 3.0 is a publishing framework for large scale data-rich interactive Web pages. It was developed jointly by MIT Libraries, MIT CSAIL and Zepheira with support from the Library of Congress.


JavaScript/JS D3 Sankey thermal 0 Zero
A general-purpose Sankey diagram builder; built on top of the Sankey library of D3.js with customizable sizing, spacing, shape, color, labels, flow-cross check, and resizing.

Java SE
GRAL is a free Java library for displaying plots (graphs, diagrams, and charts). The acronym GRAL simply stands for GRAphing Library.

JavaScript/JS jQuery anchors navigation microinteractions µ
Useful for extended text documentation, Anchorific is a jQuery plugin that automatically generates anchored headings and nested navigations based on HTML h1, h2, and h3 header tags.

JavaScript/JS D3
This is a layout function for creating paths in D3 where (unlike the native d3.svg.line() element) you need to apply specific aesthetics to each element of the line.
JavaScript/JS D3 genetic chromosome idiogram karyotype DNA bio
Ideogram is a library for visualizing haploid, diploid or higher ploidy genomes (e.g. plants), as well as aneuploidy, genetic recombination, and homologous chromosomal features; uses D3.js.


Python natural language processing NLP e-mail I2
Visualize e-mail data extracted from an IMAP server. You can see distribution of messages by time, attachment size, sender, recipient, thread length, and other message characteristics.

JavaScript/JS Python pandas NetworkX
Helps data scientists scaffold visualizations in Jupyter Notebook with D3.js and works with standard scientific Python data-structures including pandas DataFrames and NetworkX graphs.

JavaScript/JS machine learning ML neural network ANN CNN deep learning t-SNE
This tool allows you to visualise any array of vectors with a static file system and light depency stack. It is designed to be decoupled from any frontend library, however it requires Python 3.6.

Python OSM
This tool visualizes OpenStreetMap data as a 3D barplot with Blender and Python. It creates an occurence heatmap of all points that are collected within a country with a certain tag.

Elm graph theory source code
An interactive visualization tool for graph theory. Also enables visualization of module dependencies by entering GitHub repository paths for any Elm project. Kite is entirely written in Elm.

Python brain neurology scientific bio
PySurfer is a Python package for interacting with a cortical surface representations of neuroimaging data. It extends Mayavi's powerful visualization engine with a high-level interface for working with MRI and MEG data. PySurfer offers both a command-line interface designed to broadly the Freesurfer Tksurfer program and a Python library for writing scripts to efficiently explore complex datasets and prepare publication-ready figures. To goal of the project is to facilitate the production of figures that are both beautiful and scientifically informative.

F#
The Gamma is a simple JavaScript library that lets anyone create transparent and open data visualizations that are linked to the original data source and encourage the reader to further explore data and find interesting facts on their own.

JavaScript/JS D3 ullage counter

JavaScript/JS 3D munging wrangling cleaning preparation
Data Lasso is a visualization tool that runs entirely in the browser and enables data exploration. It is built to be agnostic to the structure and formatting of the underlying dataset.

JavaScript/JS lightbox microinteractions µ
FancyGrid - JavaScript grid library with charts integration and server communication.


Python JavaScript/JS Vega
Informed by the results of graphical perception experiment, Draco is a formal framework for representing design knowledge about effective visualizations as a collection of constraints (solved with the Clingo constraint solver).
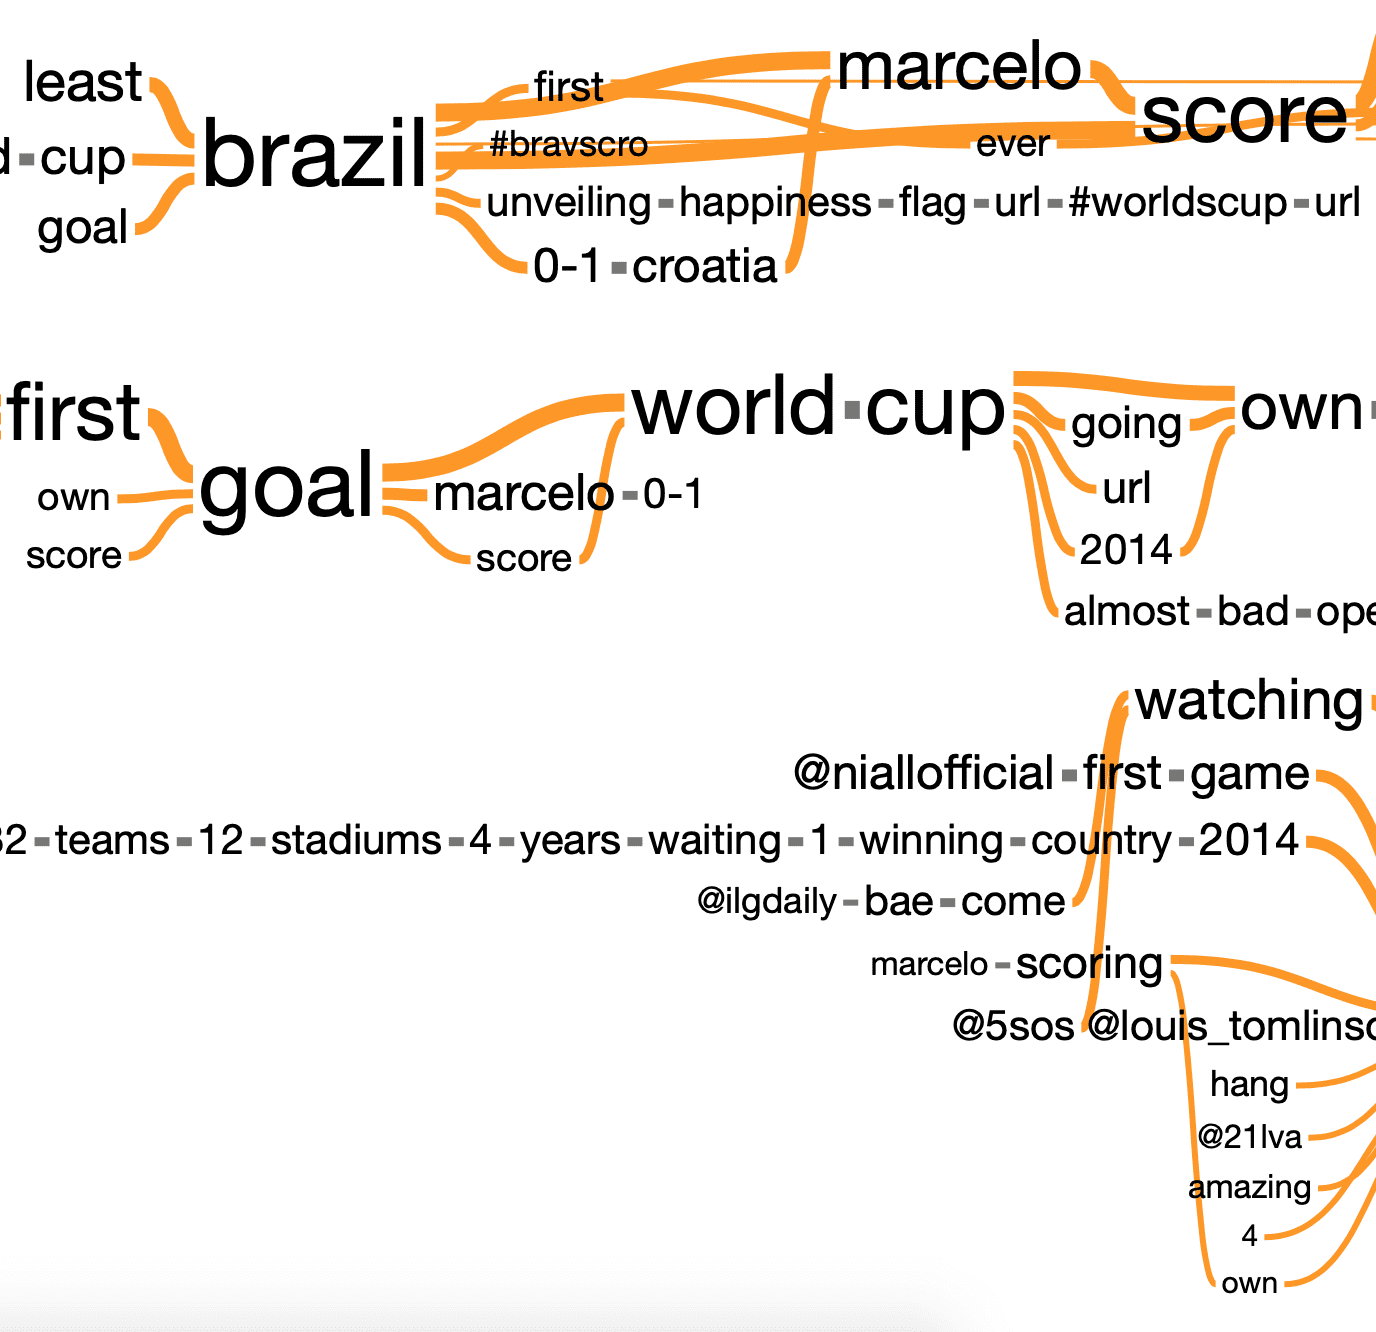
JavaScript/JS Twitter tweets
SentenTree takes thousands or more Tweets and summarizes them. The aim is to create a visualization that is cheap to compute but represents the conceptual connections in the text.


Java SE JavaScript/JS content natural language processing NLP summarization
Web-based knowledge mapping software and discovery interface for researchers conducting literature reviews; visualizes text and data connections, as well as metadata and references.

JavaScript/JS natural language processing NLP Vue
Neat (Neural Attention) Vision is a framework-agnostic visualization tool to show the attention mechanisms of deep learning Natural Language Processing (NLP) models; uses Vue.js.


JavaScript/JS D3 ullage counter microinteractions µ
Fancycharts.js is a Javascript visualization library to enhance a single percentage value with a fill rate glyph. Made on top of D3.js, it is designed to be a visual data component for texts.

JavaScript/JS D3
A framework for creating parent-child relationships with D3.js.

JavaScript/JS D3 GeoJSON TopoJSON
Developed by the MinnPost, simple-map-d3 generates choropleths with tooltips in D3.js. All you need is a latitude and longitude (EPSG:4326) based set of GeoJSON polygons or a TopoJSON file.

JavaScript/JS D3 Three.js WebGL source code
Code-is-beautiful is a state-of-the-art, cross-language code analysis tool aimed at developing more innovative ways to visualize source code in 2D and 3D. Runs on D3.js and Three.js.

JavaScript/JS voronoi
This module adapts d3.geoDelaunay() for spherical data. Given a set of objects in spherical coordinates, it carries out Delaunay triangulation and its dual, the Voronoï diagram. Also offers a GeoJSON API.

JavaScript/JS D3 annotate annotations microinteractions µ
D3.js plugin for creating and positioning circle and text annotations. Useful for commenting on an area of a graphic or map. Inspired by the swoopyDrag plugin and map annotations.

JavaScript/JS D3 equal-area square cartograms vote voting elections electoral random
Developed by The Wall Street Journal, Squaire is a D3.js library to create equal-area square cartograms with custom tooltips, numeric data labels, legends, and custom breakpoints.
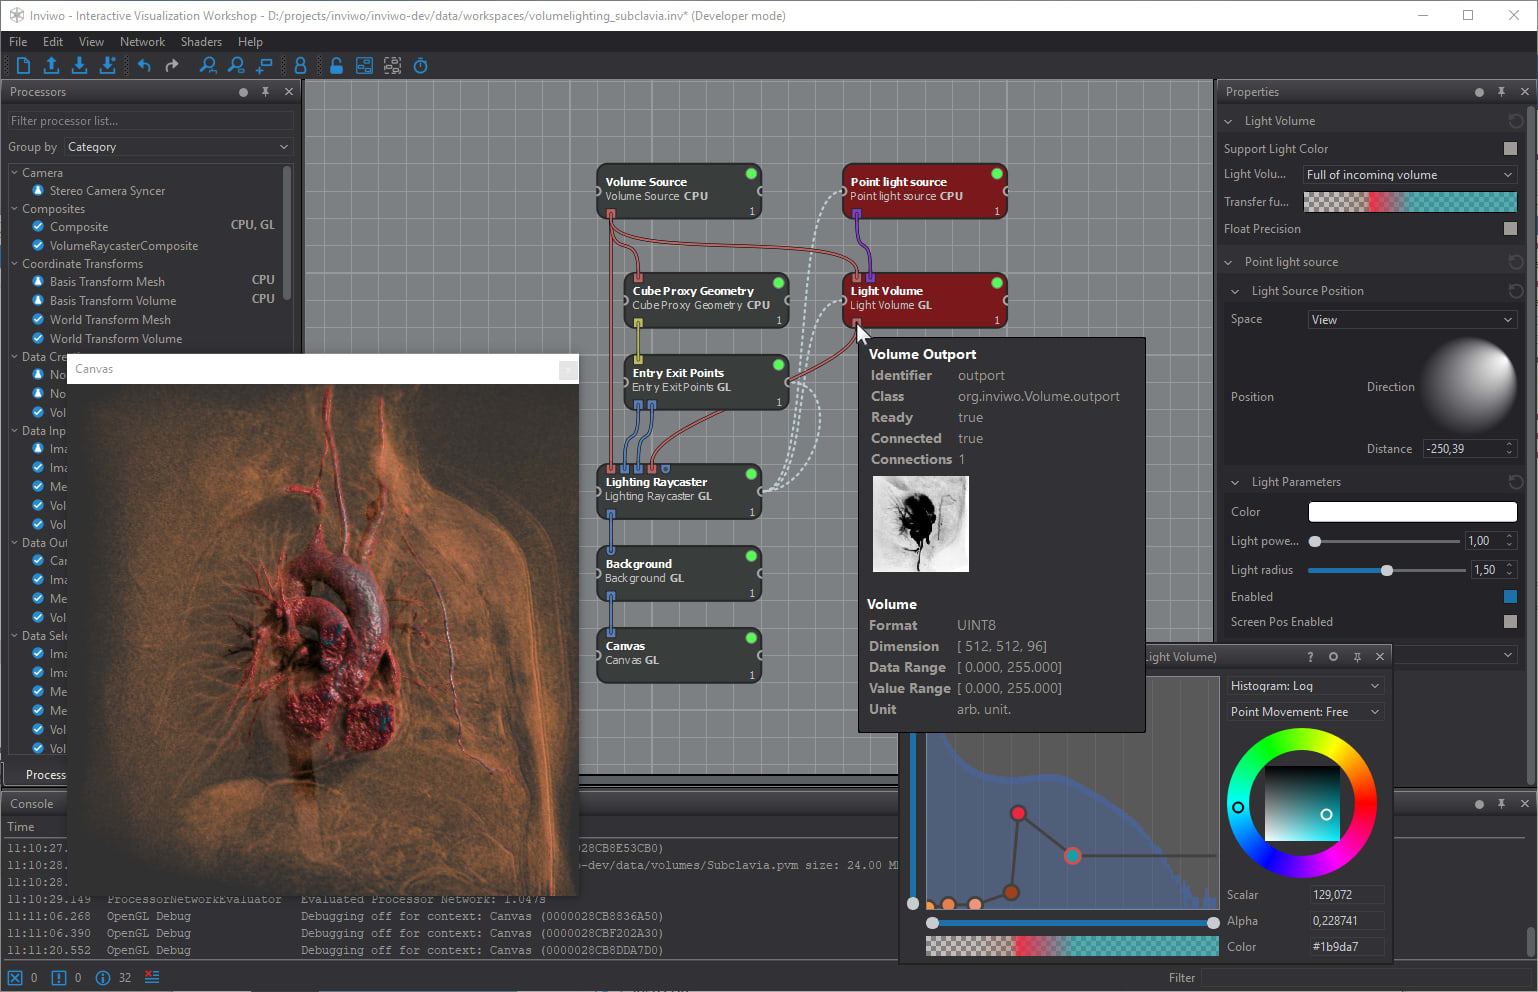
C++ Python scientific
Inviwo is a software framework for the rapid prototyping of visualizations. It is written in C++, exploits modern graphics hardware, and is available under the BSD license, which permits free use in any setup - also commercially.


JavaScript/JS D3 Sankey mathematical notation mathematics Venn sets
Declarative visualisation components for Vue.js [bar, line, area, pie, donut, stacked, sankey, timeline]

TypeScript React time series
A high-performance canvas-based time series visualization in Typescript + React.
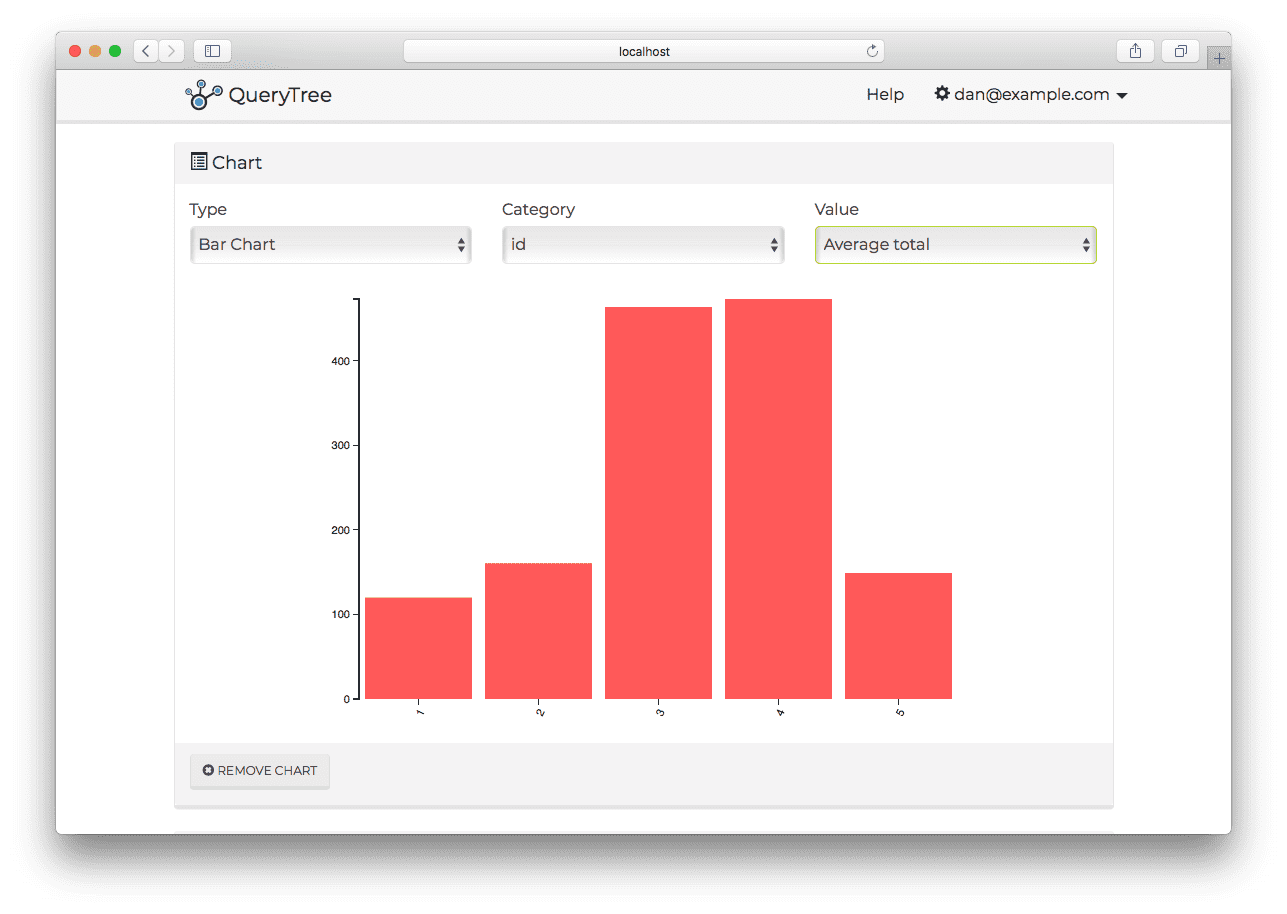
JavaScript/JS
QueryTree is an ad-hoc reporting tool that works with any Microsoft SQL Server, PostgreSQL or MySQL database. It allows users to query databases, build reports and schedule those reports to email distribution lists, without needing to write any code.


natural language processing NLP attention summarization highlighting
Visualize attention in recurrent neural networks in the context of text-based tasks like summarization. As you hover over individual words, you will see a heatmap of source attention.

Java SE UML
Umple is a model-oriented programming technology, allowing developers to embed modelling concepts (e.g. UML associations, state machines), patterns, generation templates, and other abstractions in traditional code, and vice versa. It generates high quality code for Java, C++ and PhP, as well as diagrams, metrics and many other artifacts. It can be embeded in the above languages as well as embed them.

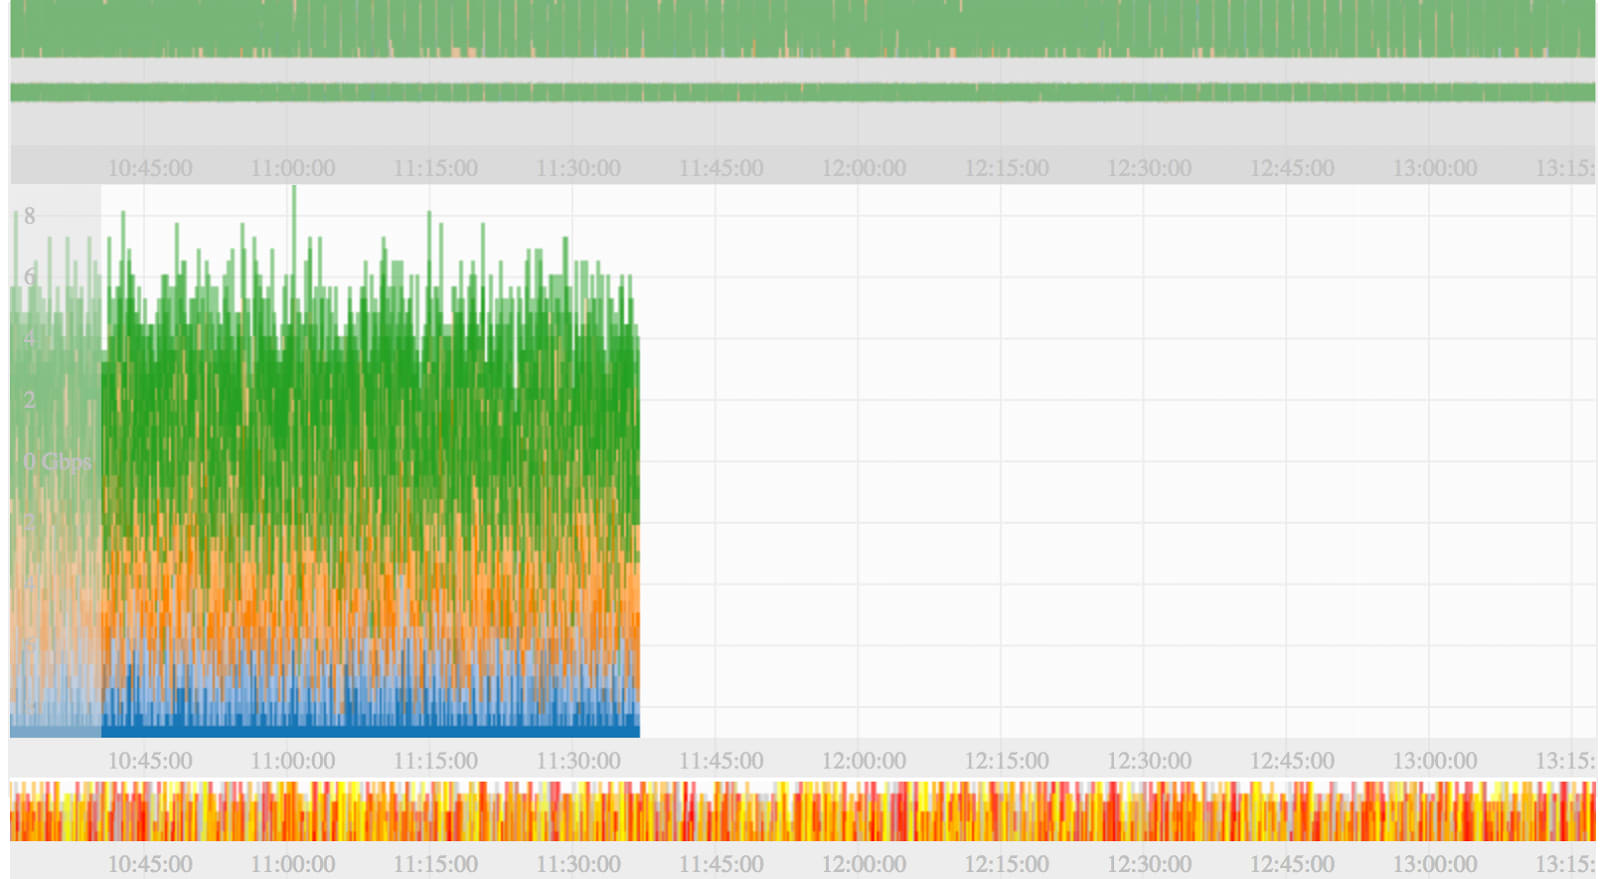
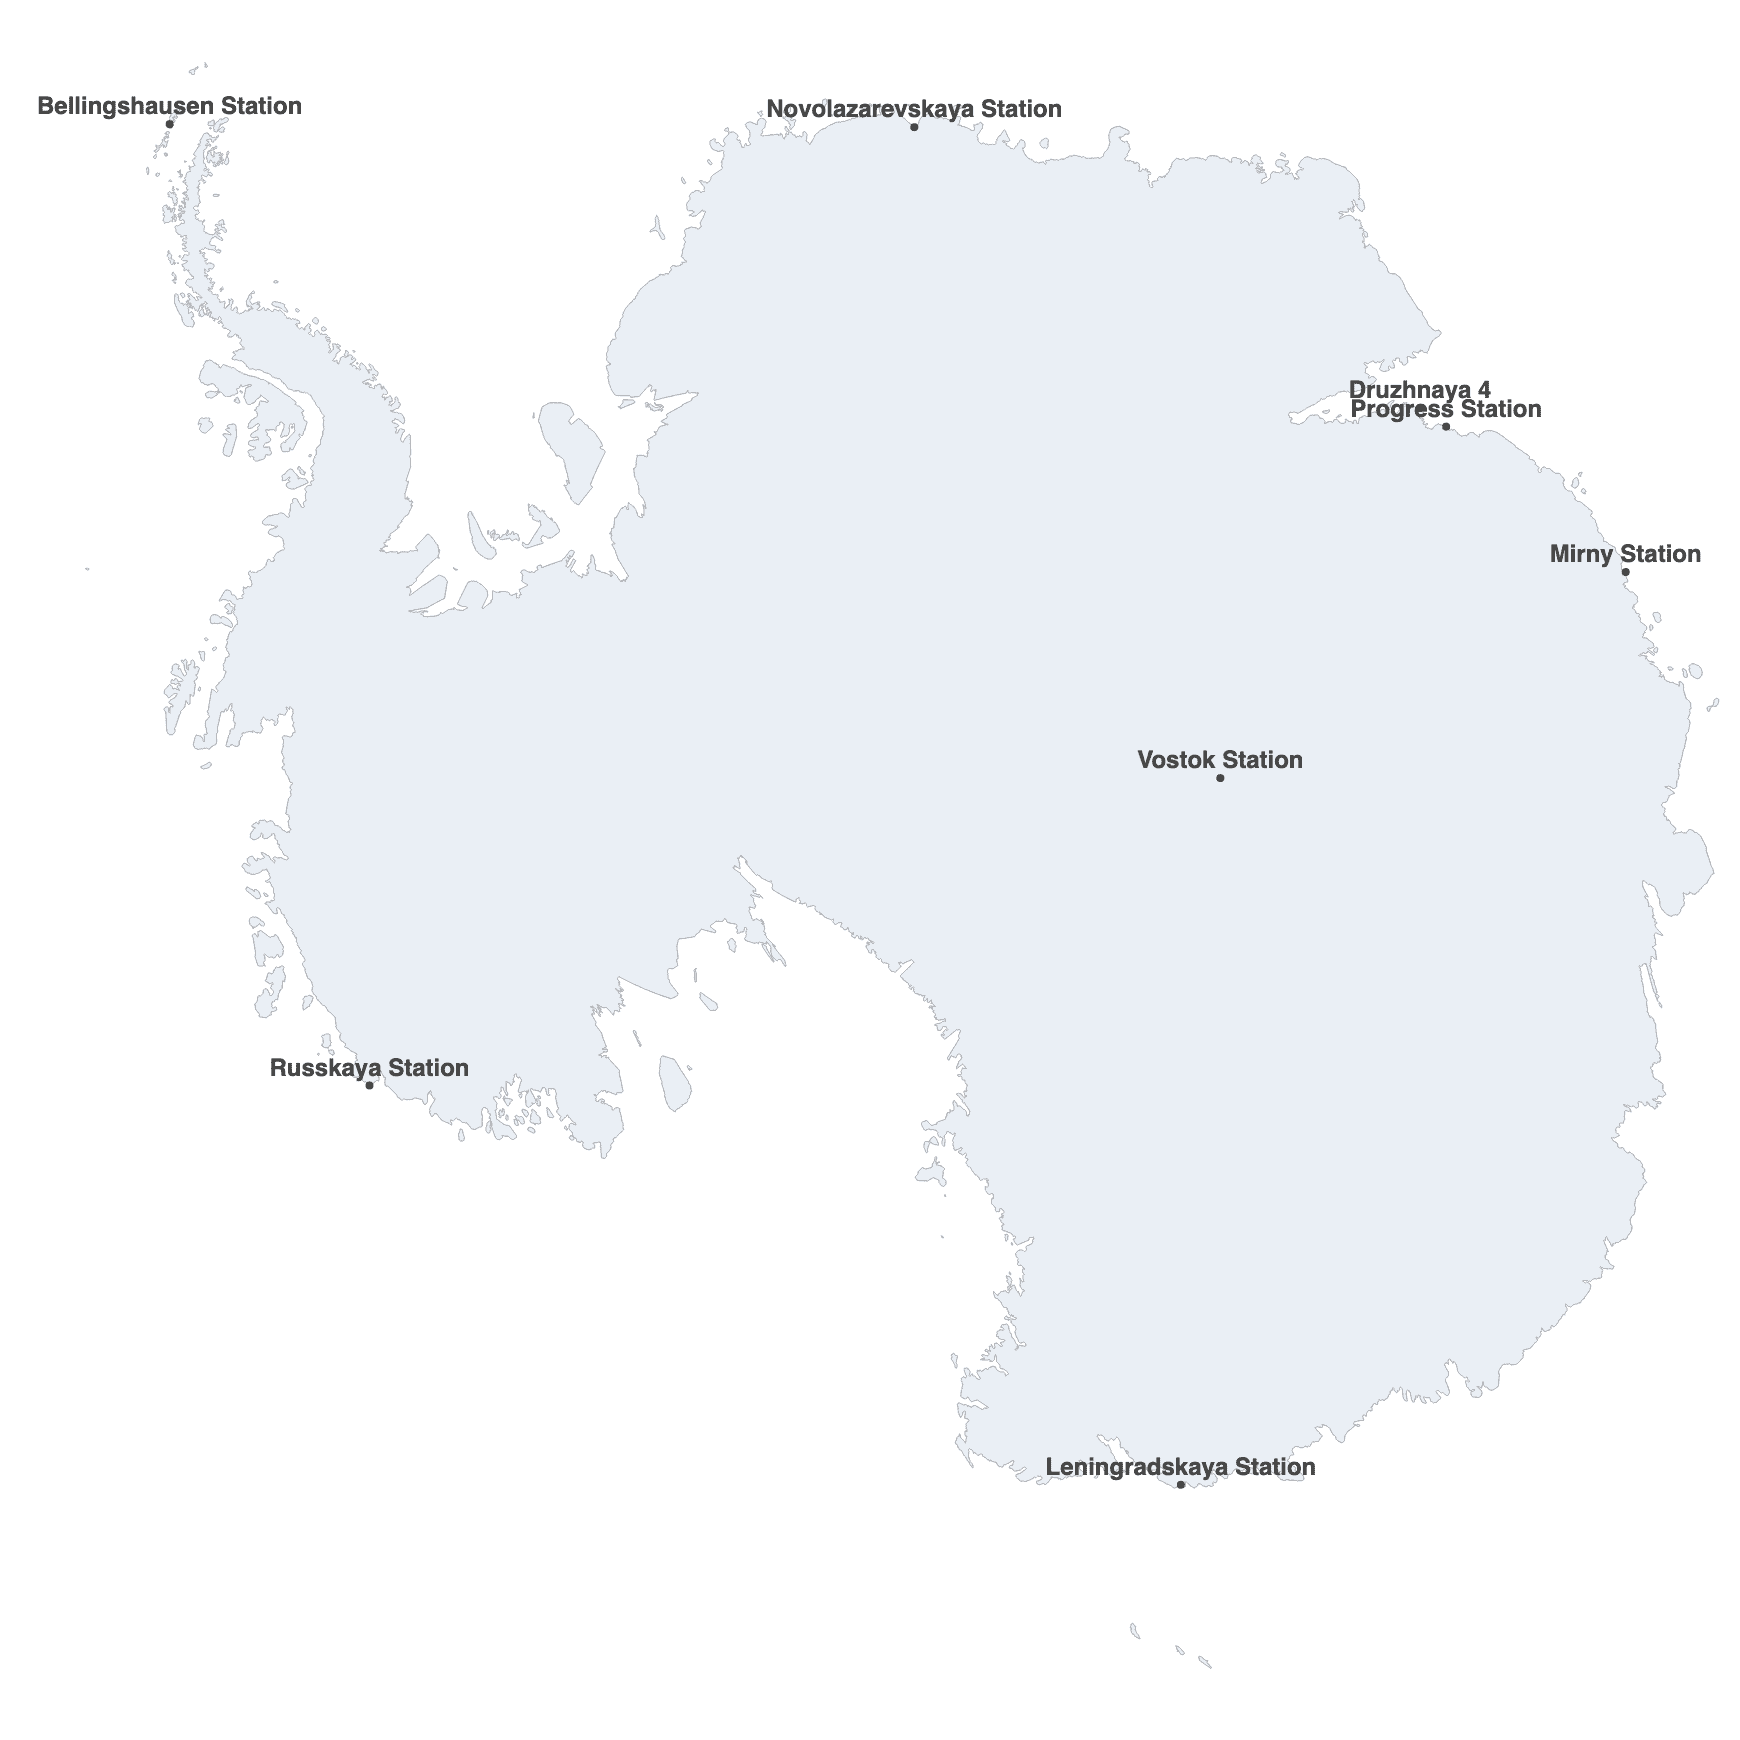
JavaScript/JS D3 TopoJSON
Spam is a small library to create modern <canvas> maps with D3.js, TopoJSON, and rbush. It makes it easy to create static or zoomable views of geodata with automatic projection and retina resolution.

JavaScript/JS Twitter
The R&D of a sentiment analysis module, and the implementation of it on real-time social media data, to generate a series of live visual representations of sentiment towards a specific topic or by location in order to find trends

JavaScript/JS D3 easy
Cirrus.js is a charts library, open sourced by Planet OS, based on a datavis pipeline going from data space to graphics space. You can learn more about the conceptual background here. From the implementation standpoint, it tries to keep a fair decoupling between all steps in the pipeline. Data, scale, layout, attribute, component, renderer, interaction. It starts with the basic charts: simple/stacked/percent bar charts and simple/multiple/stacked/area charts. But the goal is to validate if this datavis pipeline architecture makes it easy to expand indefinitely.

JavaScript/JS D3 tooltip microinteractions µ
Simple lightweight tooltip helper in D3.js; allows interface designers to modify hover behavior, transition, animation properties, overlay opacity, positioning of elements, border size, and radius.

JavaScript/JS TopoJSON d3
d3.geomap is designed to be a reusable geographic map for D3.js and TopoJSON data. In its current stage, it has two component classes: one for plain maps and another for choropleth maps.

JavaScript/JS D3
A data-driven API for interactive thematic maps, mapmap.js simplifies loading, processing and joining data and geometry, as well as applying symbolization and interaction techniques to maps.

PHP JavaScript/JS maps timelines chronology spatiotemporal digital humanities culture cultural annotate annotations literature literary culture cultural random
Neatline allows you to tell stories with elaborate maps and timelines, opening up new possibilities for interactive spatial, textual, and temporal data visualization as well as historical narrative.

JavaScript/JS D3
Earthjs is a Javascript library for generating orthographic globes. Inspired by planetary.js's <canvas> approach and Faux-3D Shaded Globe's SVG methods, Earthjs uses D3-v4 components.
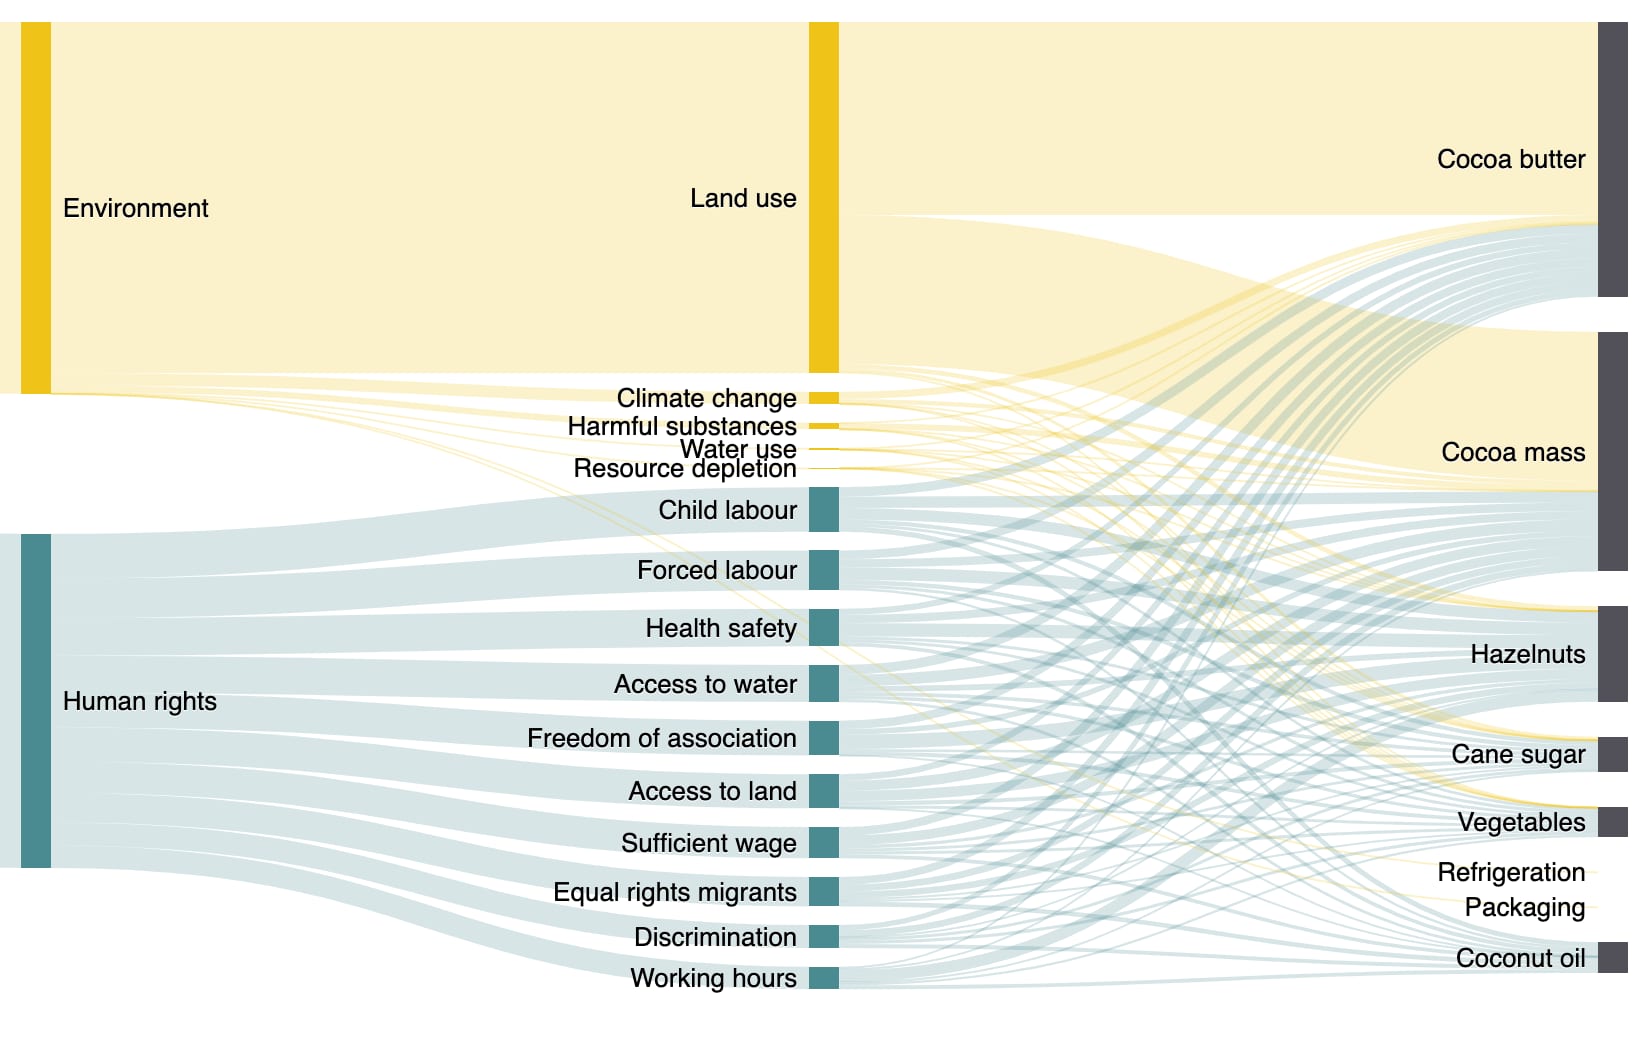
JavaScript/JS D3 Sankey
Reusable diagrams for three chart types: Sankey, Sankey.Selection and Sankey.Path. The last two add mouseover/hover effects as well as connected nodes and links.

Python scientific
VisTrails is an open-source data analysis and visualization tool. It provides a comprehensive provenance infrastructure that maintains detailed history information about the steps followed and data derived in the course of an exploratory task: VisTrails maintains provenance of data products, of the computational processes that derive these products and their executions.

JavaScript/JS D3 color
A custom D3 scale powered by a 1-dimensional clustering algorithm. Similar to quantile scales, the cluster scale maps a continuous input domain to a discrete range. The number of values in the output range determines the number of clusters that will be computed from the domain.

R-project
Cartogram heatmaps are a compelling alternative to choropleth maps; they preserve the geographic placement of states while introducing the look and feel of a traditional heatmap.

JavaScript/JS
Mapsense.js is a JavaScript library for in-browser vector maps. Based on the Polymaps API, it combines the scalability of tiled geographic datasets with the interactivity and control of D3.js.

C++ GL
Drishti is an open-source scientific visualisation software designed by Ajay Limaye at the National Computational Infrastructure's VizLab. The central idea of Drishti is that scientists can use it to explore and present volumetric datasets without extensive training. Drishti has been developed with its end use in mind: ie. visualising volumetric data, such as tomography data, electron-microscopy data, etc. Drishti works on GPUs with OpenGL 2.0 capability. Drishti stands for vision or insight in Sanskrit, an Indian language.

JavaScript/JS TopoJSON D3
A tiny D3.js extension that lets you turn your maps and TopoJSON data into other types of charts. Move and resize geographic features with a variety of animation and alignment options.

JavaScript/JS D3 message sequence
Generate simple static and dynamic message sequence charts in D3.js; adjust fade property and add multiple messages, stages, and information exchange outputs to your visualization.
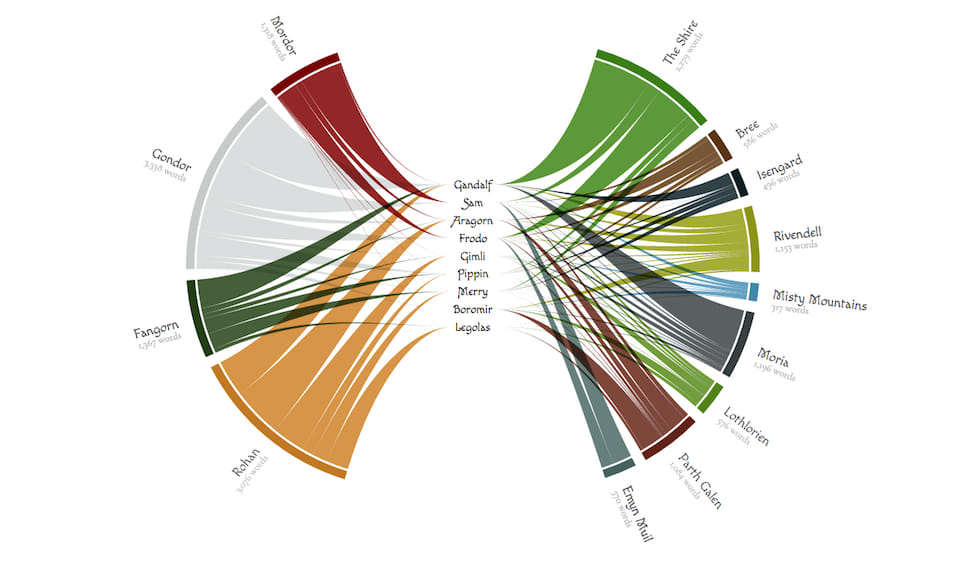
JavaScript/JS D3
The loom layout is meant to create a chart with a group of entities in the center and different group of entities on the outside. They are connected by strings where the thickness of the string on the outside represents the connection (i.e. value) of the inner and outer entity.

Java SE bigdata tilesets tilemaps
Aperture Tiles provides the ability to create browser-based, interactive tools any analyst can use to explore data sets containing billions of data points (or more).

JavaScript/JS D3 count voting elections electoral
A D3 plugin targeting V4 helping you to draw an array of icons.

JavaScript/JS D3 voronoi
Produces Voronoï treemaps. Given a convex polygon and nested weighted data, it tesselates/partitions the polygon in several interior cells with hierarchy, grouping, and weighting.
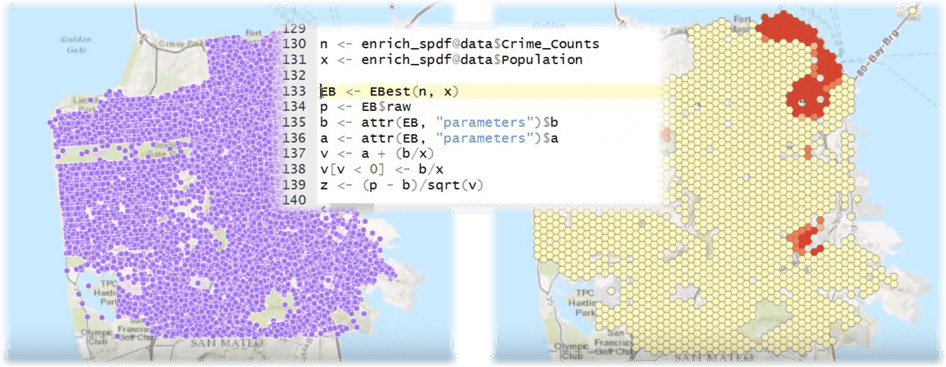
C++ Python
Combine the power of ArcGIS and R to solve your spatial problems. Requires R Statistical Computing Software, 3.3.2 (or later), along with ArcGIS 10.3.1 (or later) or ArcGIS Pro 1.1 (or later).
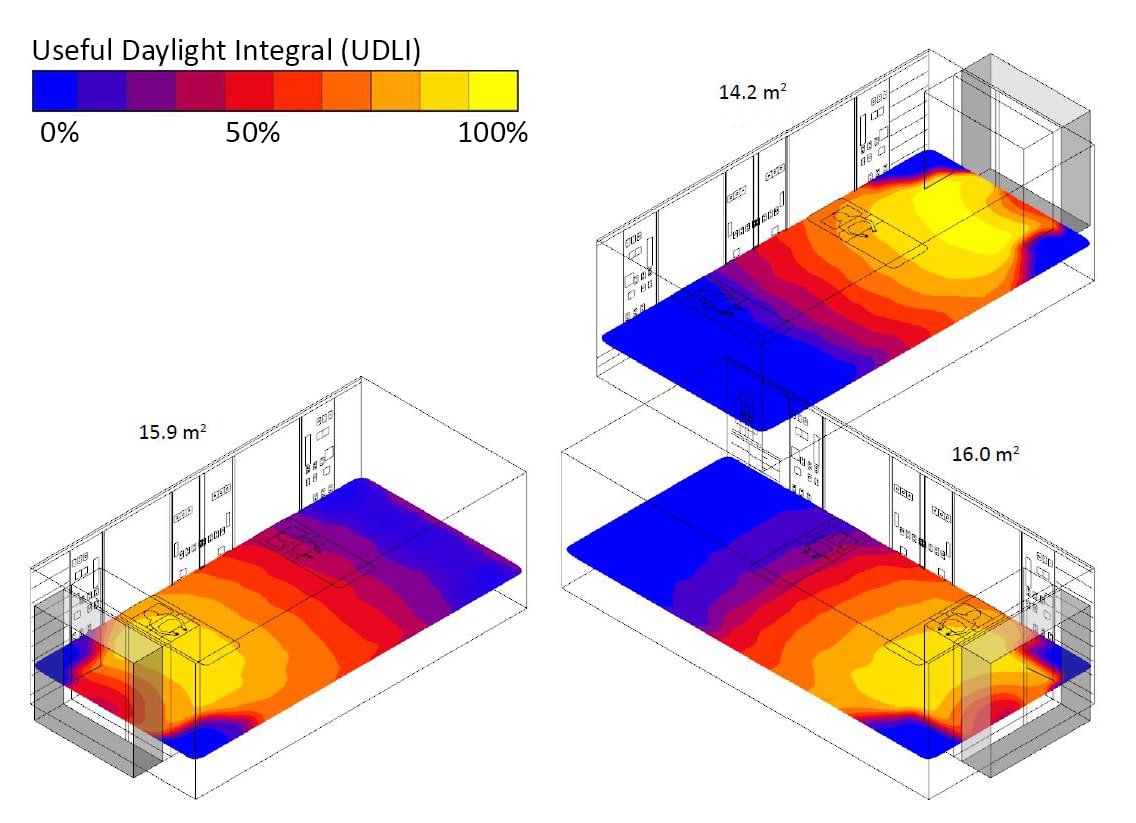
Python daylight thermal energy analys illuminance sun glare HVAC microclimate visibility orientation orbitology space
Honeybee is a Python library to create, run and visualize the results of daylight analysis, sun exposure/glare, HVAC sizing, and heating/cooling simulation.

JavaScript/JS D3
lasso.js is a D3 plugin that allows you to tag elements on a page by drawing a line over or around objects. Functions can be run based on the lasso action. This functionality can be useful for brushing or filtering.

JavaScript/JS D3
Faster force-directed graph layouts by reusing force approximations. This module includes d3.forceManyBodyReuse(), a faster version of the repulsive force algorithm in d3-force. In practice, d3.forceManyBodyReuse() can decrease force-directed graph layout runtimes by 10% to 90% depending on the graph without a decrease in layout quality (as measured by graph layout quality metrics). How does it achieve the performance speedup? The standard D3 algorithm uses the Barnes–Hut approximation to speed up the force calculations, which bases the force approximations on a quadtree that is recalculated after every tick of the layout algorithm. To reduce the runtime, d3.forceManyBodyReuse() only recalculates the quadtree once every 13 ticks. Experiments show that this is enough to achieve good quality graph layouts while still greatly speeding the algorithm.


JavaScript/JS D3 gridding template
Create rapid mock-ups for D3 charts, using data-driven grids.

JavaScript/JS D3 time series financial
Implementing a better time series charting library, based on d3.js
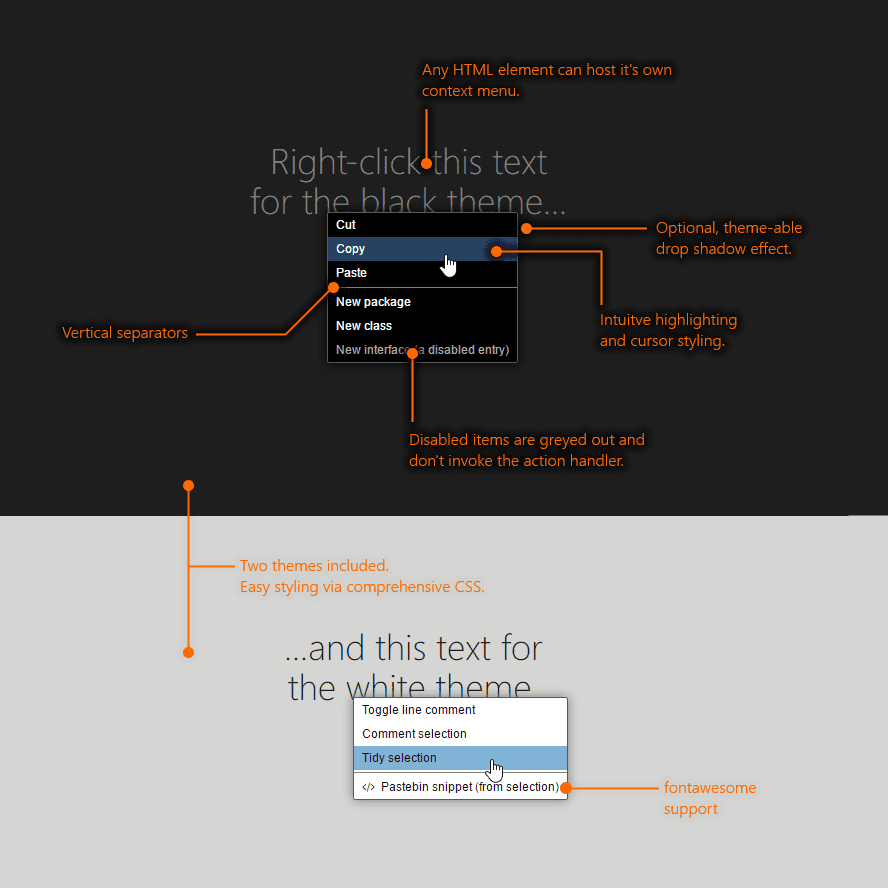
JavaScript/JS typography microinteractions µ
Context menus in pure JavaScript (no jQuery); menus are auto-positioned relative to the mouse position and window dimensions, with fade-in and fade-out and fontawesome icon support.


JavaScript/JS
Clipping and geometric operations for spherical polygons; includes Buckminster Fuller 's Airocean (Dymaxion) projection and the Cahill-Keyes polyhedral projection, among others.
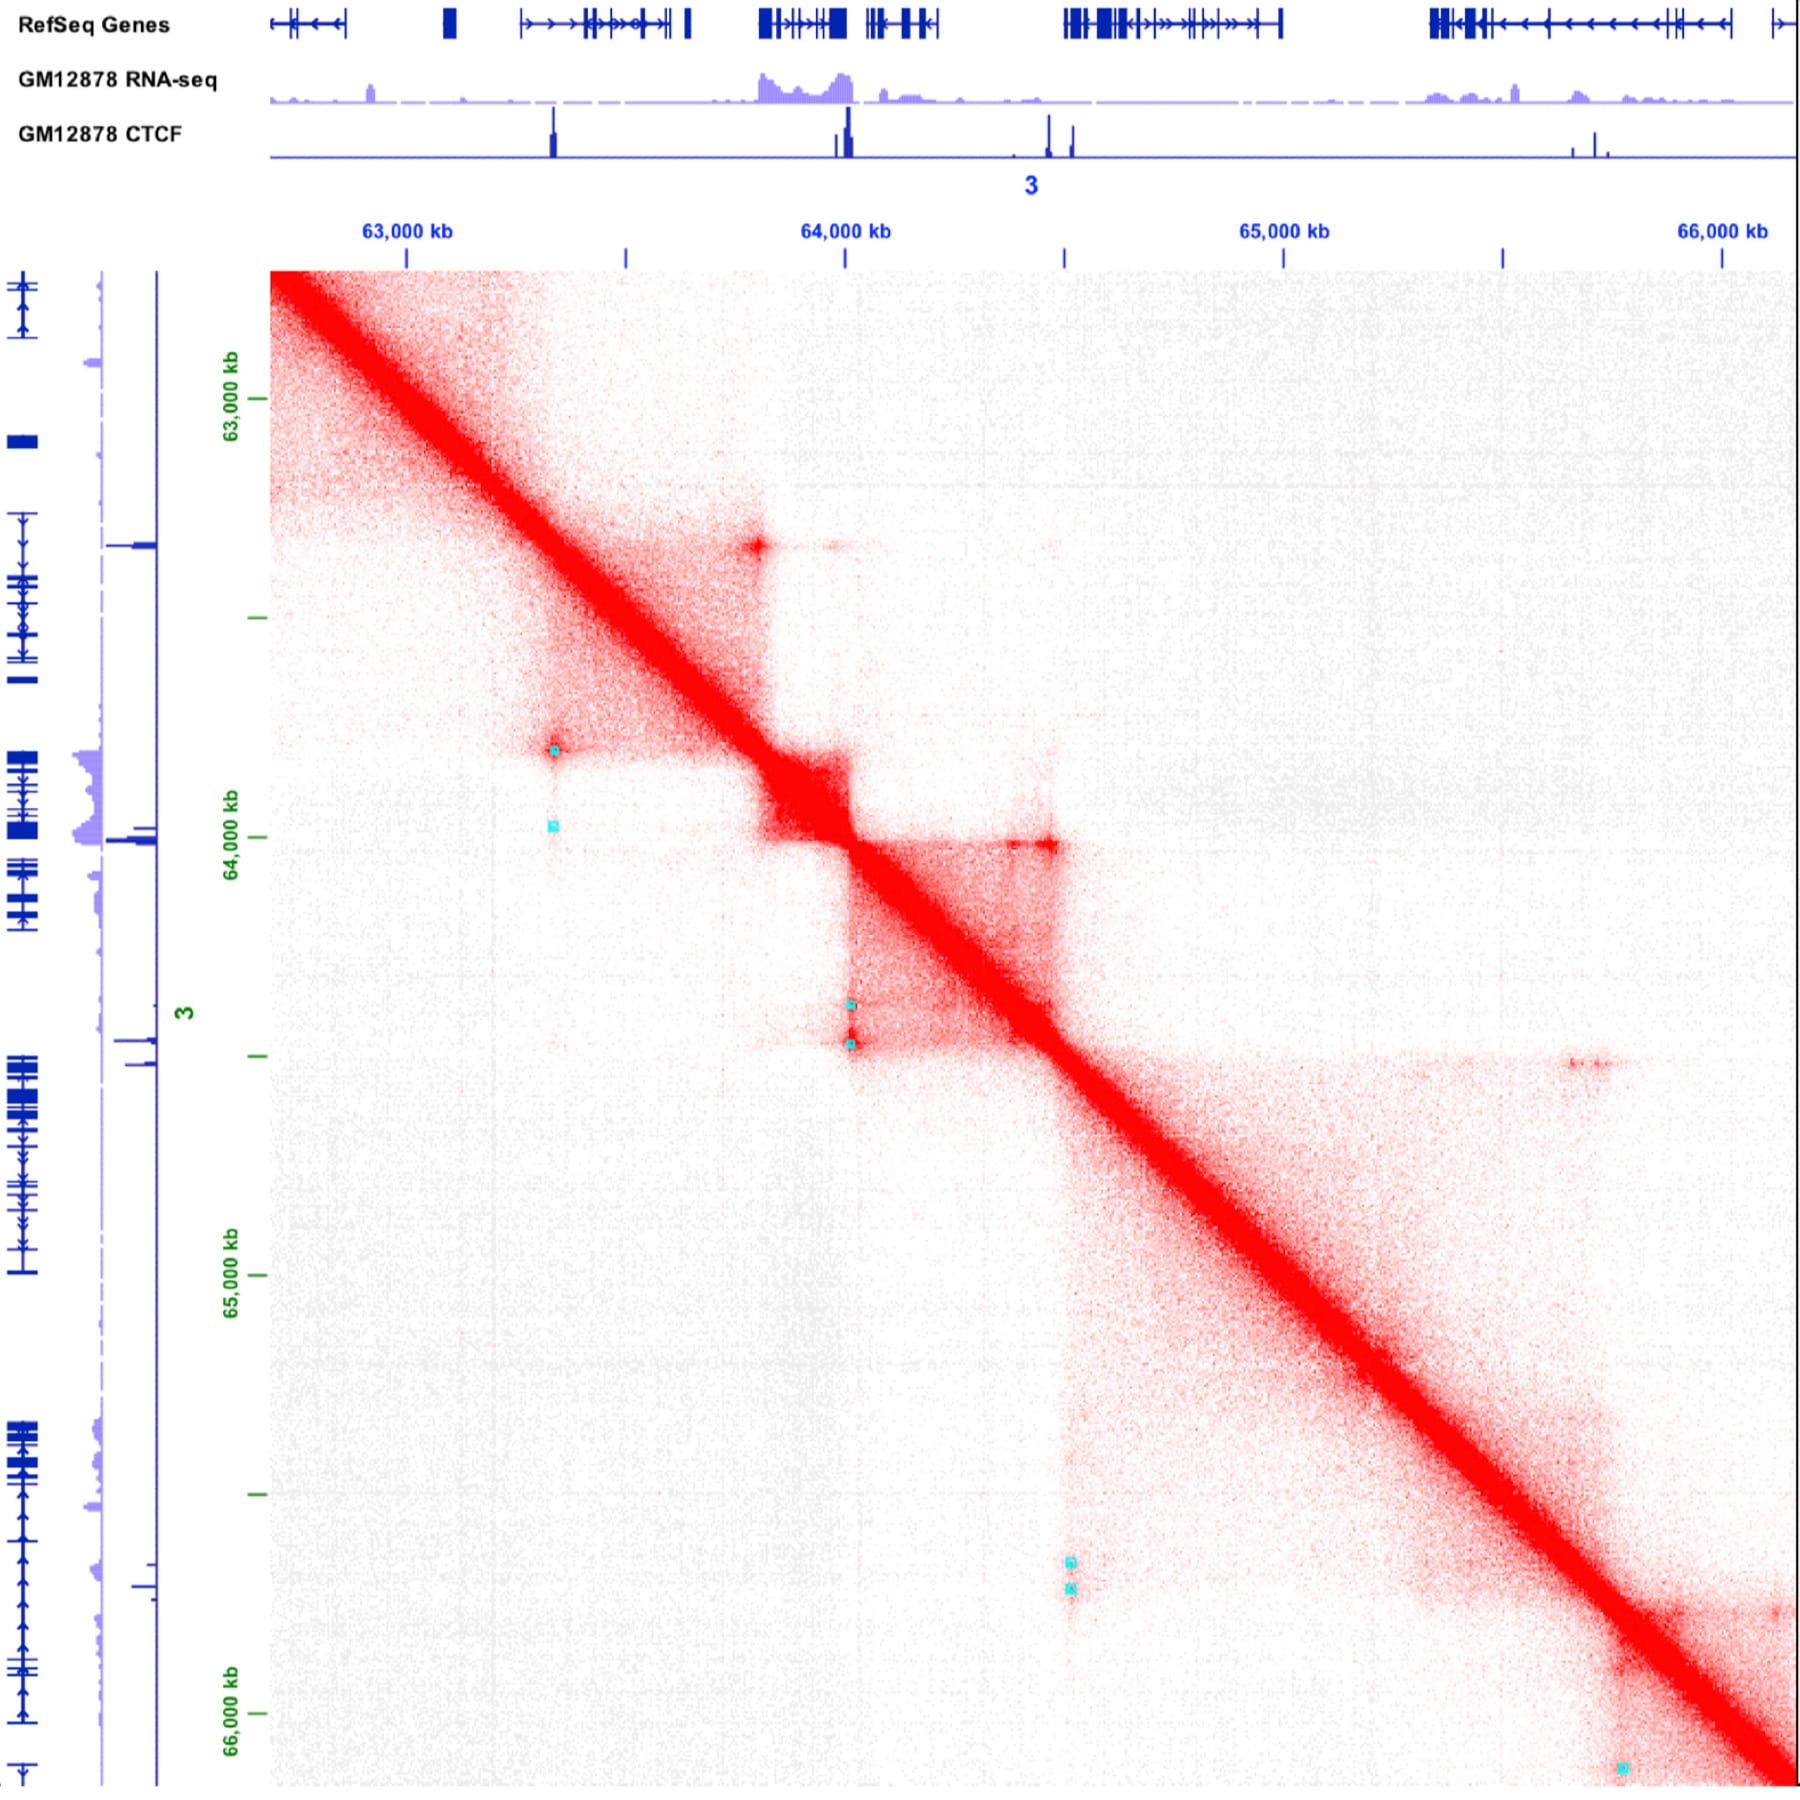
Java SE bio gene genome statistics statistical scientific
Juicebox.js is cloud-based visualization software for Hi-C data. It can visualize and interactively (re)assemble genomes.
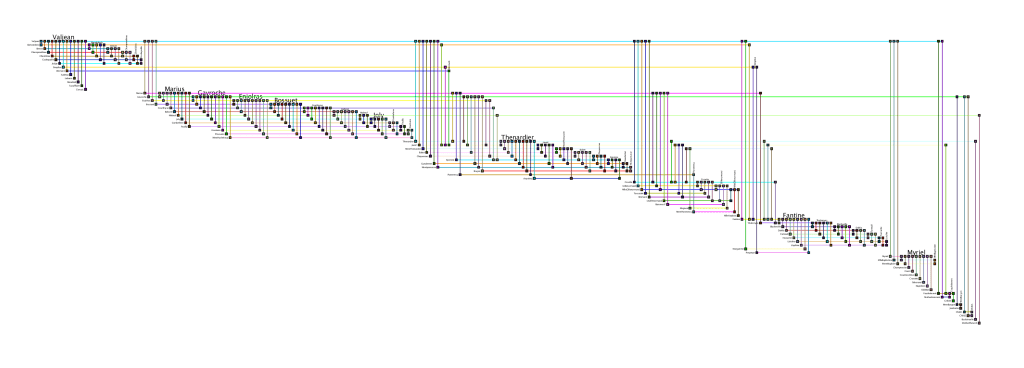
Java SE
BioFabric uses a novel network presentation method that represents nodes as horizontal line segments, one per row. Edges are represented as 1D vertical line segments, one per column.

JavaScript/JS
Set of D3.js projections for showing countries' distant lands together, so that continental landmasses/core metropolitan regions and overseas territories appear in a single composite view.

JavaScript/JS D3
D2B is a reusable charting library that uses the data visualization library D3.js. D2B is packed full of features for various types of charts. It also includes hooks to customize each chart to fit your needs. Take a look at the demos below to get an idea of what D2B can do.

JavaScript/JS D3 tooltip voronoi soap
A D3.js-based tooltip system designed to be simple, fast, and small with a fluent API. Tooltips are evaluated in a lazy fashion, allowing for thousands in parallel without loss of performance.

Python content natural language processing NLP summarization highlighting latent Dirichlet allocation LDA
Integrated system for text modeling; go from a set of documents to an interactive visualization of latent Dirichlet allocation (LDA) topic models generated using the InPhO VSM module.

JavaScript/JS D3
A smart SVG text box with line wrapping and automatic font size scaling.

PHP
JpGraph is an Object-Oriented Graph creating library for PHP5 (≥5.1) and PHP7.0 The library is completely written in PHP and ready to be used in any PHP scripts (both CGI/APXS/CLI versions of PHP are supported).

JavaScript/JS
Distill your data to three different sets of visual components (Map, Filters, Table) with programmatically generated lists of dropdowns and input fields that allow users to drill down into the underlying data.

JavaScript/JS D3 circular
A control for selecting cyclical data. Like d3.svg.brush, it fires "brushstart", "brush" and "brushend" events when you drag the resize areas or extent.

Groovy JavaScript/JS
Neon is a datastore agnostic visualization framework with data querying and filtering, aggregation, and transforms. It has two parts: neon-server (RESTful API) and neon-client (JavaScript API).

JavaScript/JS jQuery typography microinteractions µ
Built in plain JavaScript, Vanilla Marginotes takes your jQuery selection, HTMLCollection, or Array of DOM elements and adds notes to the margin with the text provided in HTML attributes.

C++ graph analysis social network I2
Social Network Visualizer (SocNetV) is a cross-platform, user-friendly free software application for social network analysis and visualization.

JavaScript/JS Mapbox jQuery leaflet OpenStreetMap OSM
Print Map Maker allows designers to create high quality maps that look crisp on newsprint; uses the Mapbox version of leaflet.js, jQuery-geocodify, as well as OpenStreetMap data.

R-project raster
Visualization methods for both quantitative and categorical data; capable of working with univariate and multivariate rasters; also handles spatiotemporal rasters and vector fields.

Python ensemble statistics statistical
This is Slycat - a web-based ensemble analysis and visualization platform, created at Sandia National Laboratories.

JavaScript/JS jQuery microinteractions µ No License
Confirm with users before opening any mailto link on the page through their default email client.

Perl content natural language processing NLP Kohonen SOM
Free computational linguistics software for text mining in Catalan, Chinese, Dutch, English, French, German, Italian, Japanese, Korean, Portuguese, Russian, Slovenian and Spanish.
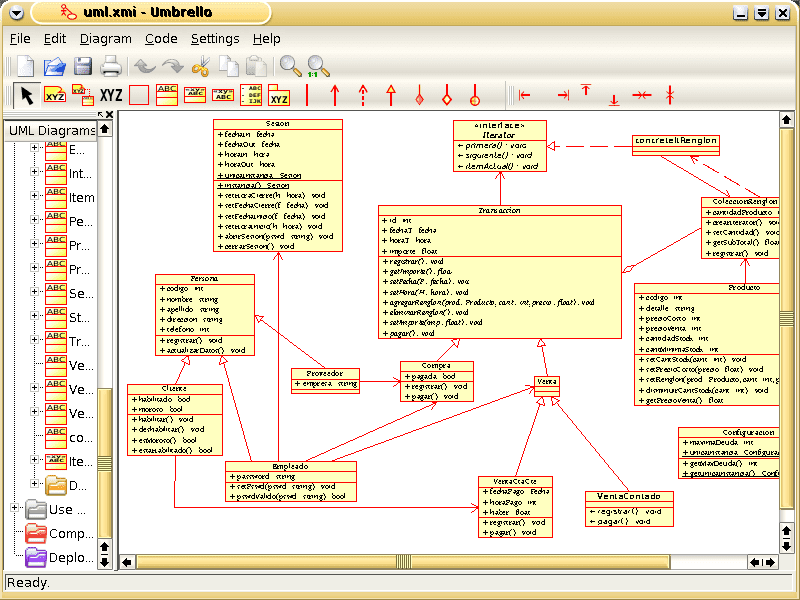
C++ UML
Umbrello is a UML diagramming tool for KDE built in C++. UML lets you create models of object orientated software systems in a standard language that describes the structure of the system.

Javascript/JS Java SE Sankey financial
Developed as part of DARPA XDATA, Influent visualizes financial transaction flows, rapidly revealing actors and behaviors of potential concern that might otherwise go unnoticed.

C++
Tulip is an open source, cross-platform, datavis framework mainly dedicated to the analysis, the drawing and the visualization of very large graphs (i.e. millions of nodes and edges).

JavaScript/JS D3 wavelet transform time series
Find peaks in an array based on Du, Pan, Warren A. Kibbe, and Simon M. Lin. "Improved peak detection in mass spectrum by incorporating continuous wavelet transform-based pattern matching." Bioinformatics 22.17 (2006): 2059-2065.

JavaScript/JS annotate annotations D3 microinteractions µ
A library for placing labels in areas; useful for streamgraphs and stacked area chart visualizations. For datasets with large gaps between X coordinates, interpolation feature improves label placement.

C++ scientific statistics statistical
LabPlot is a KDE-application for interactive graphing and analysis of scientific data. LabPlot provides an easy way to create, manage and edit plots and to perform data analysis.

JavaScript/JS Python content natural language processing NLP highlighting
Termite is a visual analysis tool for processing and inspecting the output of statistical topic models, using seriation, a tabular layout, and interactivity to facilitate comparison.
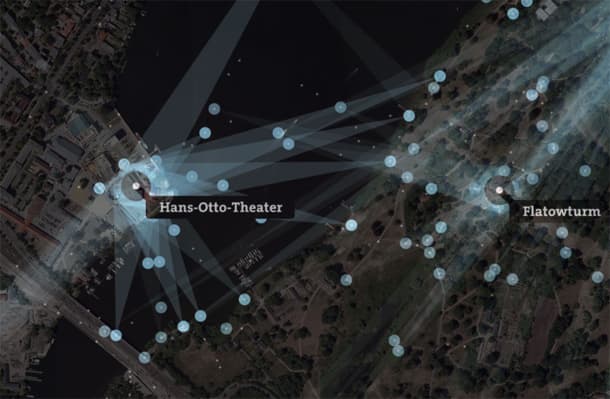
Java SE
Unfolding is a library to create interactive maps and geovisualizations in Processing and Java. Includes basic Zoom & Pan interactivity, and optional Overview+Detail or multitouch gestures.
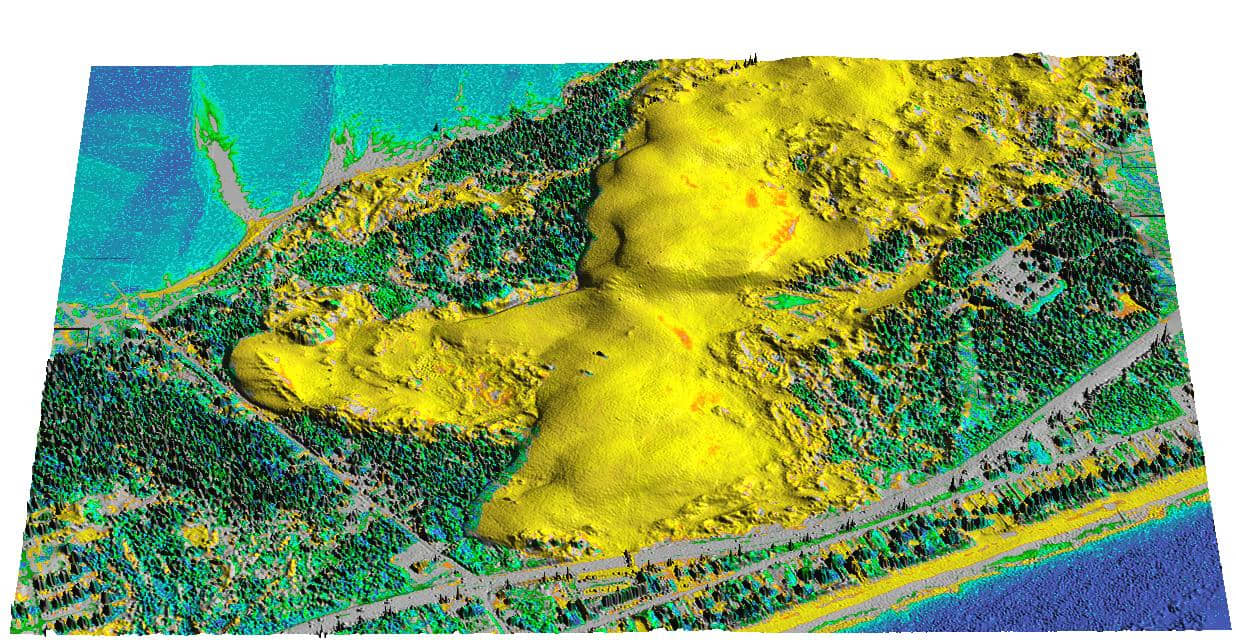
GIS management C Python
GRASS GIS is a free and open source geospatial data management and analysis suite featuring image processing, graphic and map production, spatial modeling, and geovisualization.

JavaScript/JS jQuery forms counter typography microinteractions µ
A jQuery plugin for textarea, text, and password inputs to add a character counter bubble that fades in while you type and fades out when you stop typing, useful for constraining free text areas.

JavaScript/JS easy
Easychart is a graphical user interface built on top of the stunning Highcharts-javascript library.

JavaScript/JS musical random culture cultural
Visual speecheditor for adding musical scores, tracks, loops, and tonal underlays to audio stories (à la This American Life). Instead of using waveforms, edit audio with text.

JavaScript/JS jQuery typography microinteractions µ
A small jQuery plugin to generate hand-drawn strikethroughs over your text while preserving underlying context, copy-paste, page zoom, accessibility, and @media queries.

Perl circular bio
Circos is a software package for visualizing data and information with pleasant symmetries in a circular layout. This makes Circos ideal for exploring relationships among objects.

JavaScript/JS timelines
Timeline is a web widget for visualizing temporal data. Timeline consists entirely of static files (javascript libraries, image files and css files). All you really need is to serve those resources off a web server without having to install any special server side functionality. Therefore any web server will do.

JavaScript/JS AngularJS
Angular plugin for building scale of items. Chart ruler completely on HTML/CSS/JS. Bar chart, line chart, calendar view visualisation. Diagram, graph, pyramid visualisation of large datasets.

JavaScript/JS D3 minified correlation matrix
d3-ez is a library of reusable charts which use D3.js. Inspired by Mike Bostock's tutorial Towards Reusable Charts, the aim of the library is to harness the power of D3, whilst simplifying the process of creating charts and graph making with D3. d3-ez makes it easier for people who are still learning JavaScript or D3 to quickly produce data visualisations with minimal code.

JavaScript/JS typography microinteractions µ
Add superscript numbers to text that automatically link to corresponding footnotes below. Conversely, footnotes link back up to previous reading position within the body of the text.

C# UML
NClass is a free tool to easily create UML class diagrams with C# and Java language support. The user interface is designed to be simple and user-friendly for easy and fast development.

R-project statistics statistical small multiple
Tools for graphical inference: prevent fooling yourself with the Rorschach protocol and check the surprising features in your data with the lineup protocol!

JavaScript/JS Python React content natural language processing NLP highlighting
Intertext combines machine learning (minhashing vectorized strings) with interactive React-based visualizations to surface intertextual patterns in large corpora.

R-project vote voting elections electoral equal-area square cartograms
ProPublica makes United States Congress member votes available and has developed their own unique cartogram to visually represent this data as has GovTrack. Tools are provided to retrieve voting data, prepare voting data for plotting with ggplot2, create vote cartograms and theme them.

JavaScript/JS D3 random
An extension to d3-drag that continues the mouse movement with some inertia (by default, 5 seconds). The inertia object exposes a position and a velocity, that correspond to the mouse coordinates relative to the target of the d3.drag method. During the drag gesture, the position just follows the mouse, and the velocity accumulates the movement. When the drag gesture ends, the render() method is called repeatedly with a tweening argument t that goes from 0 to 1. It is up to you to know what to do with these vectors.

JavaScript/JS Leaflet d3 CSV GeoJSON TopoJSON
Layers GeoJSON data onto a leaflet.js map using D3.js; includes Stamen Terrain and Stamen Watercolor map styles; includes TopoJSON, pathClass, and JSON, CSV, XML, TEXT, TSV, HTML options.

JavaScript/JS e-mail I2
Newman is a tool to quickly analyze and explore email using advanced analytics and visualization techniques - things not possible with traditional email applications. (JavaScript, Python)

JavaScript/JS raster
Wikimaps-D3js Atlas -- A command line utility to convert massive GIS sources into elegant administrative and topographic raster, topojson files and web friendly SVG maps.

JavaScript/JS D3 source code
jsdoc2diagram is a JSDoc template that creates a tree diagram from your software project's source code, JSDoc markup, and accompanying documentation; built using D3.js.

JavaScript/JS D3 Sankey thermal
D3.js-based Sankey diagram generator; supports self loops, vertical and horizontal manipulation, adjustments to link opacity and node spacing, as well as loading and saving diagrams.

JavaScript/JS Python content natural language processing NLP
WordSeer 4.0 is a text analysis and visualization tool built for processing XML-structured documents using visual hierarchy and color; runs on local machines and on shared servers.

JavaScript/JS minified jQuery microinteractions µ
Wrangle is a responsive, touch-friendly selection plugin for jQuery or Zepto. Wrangle offers a unique method of multiple selection: by drawing a line through items to select them. The plugin is lightweight and designed to be exstensible and adaptable. It's also highly experimental, due in no small part to the diversity of touch implementations in various devices and browsers.

JavaScript/JS bio phylogenetic trees
An open-source interactive web app for visualising phylogenomic data. Originally designed for epidemiologists and outbreak response, but capable of visualizing a diverse range of datasets.

JavaScript/JS GeoJSON KML
This tool allows you to highlight an area of interest on Google Maps; allows users to draw the geomask and grab the coordinates as a GeoJSON FeatureCollection, a KML Polygon, or a google.maps.Polygon.
C++ security documentation
keystroke visualizer for Windows, lets you easily display your keystrokes while recording screencasts. small footprint (one 100kb executable files.

JavaScript/JS D3 minified easy
Combining the power of the D3.js data-driven documents visualisation library, and the X3DOM declarative 3D DOM framework, d3-x3dom makes it easy to quickly produce beautiful 3D data visualisations with minimal code. Inspired by Mike Bostock's reusable charts, d3-x3dom is built on a foundation of building blocks, called components, which can be combined to create a variety of different data visualisations.
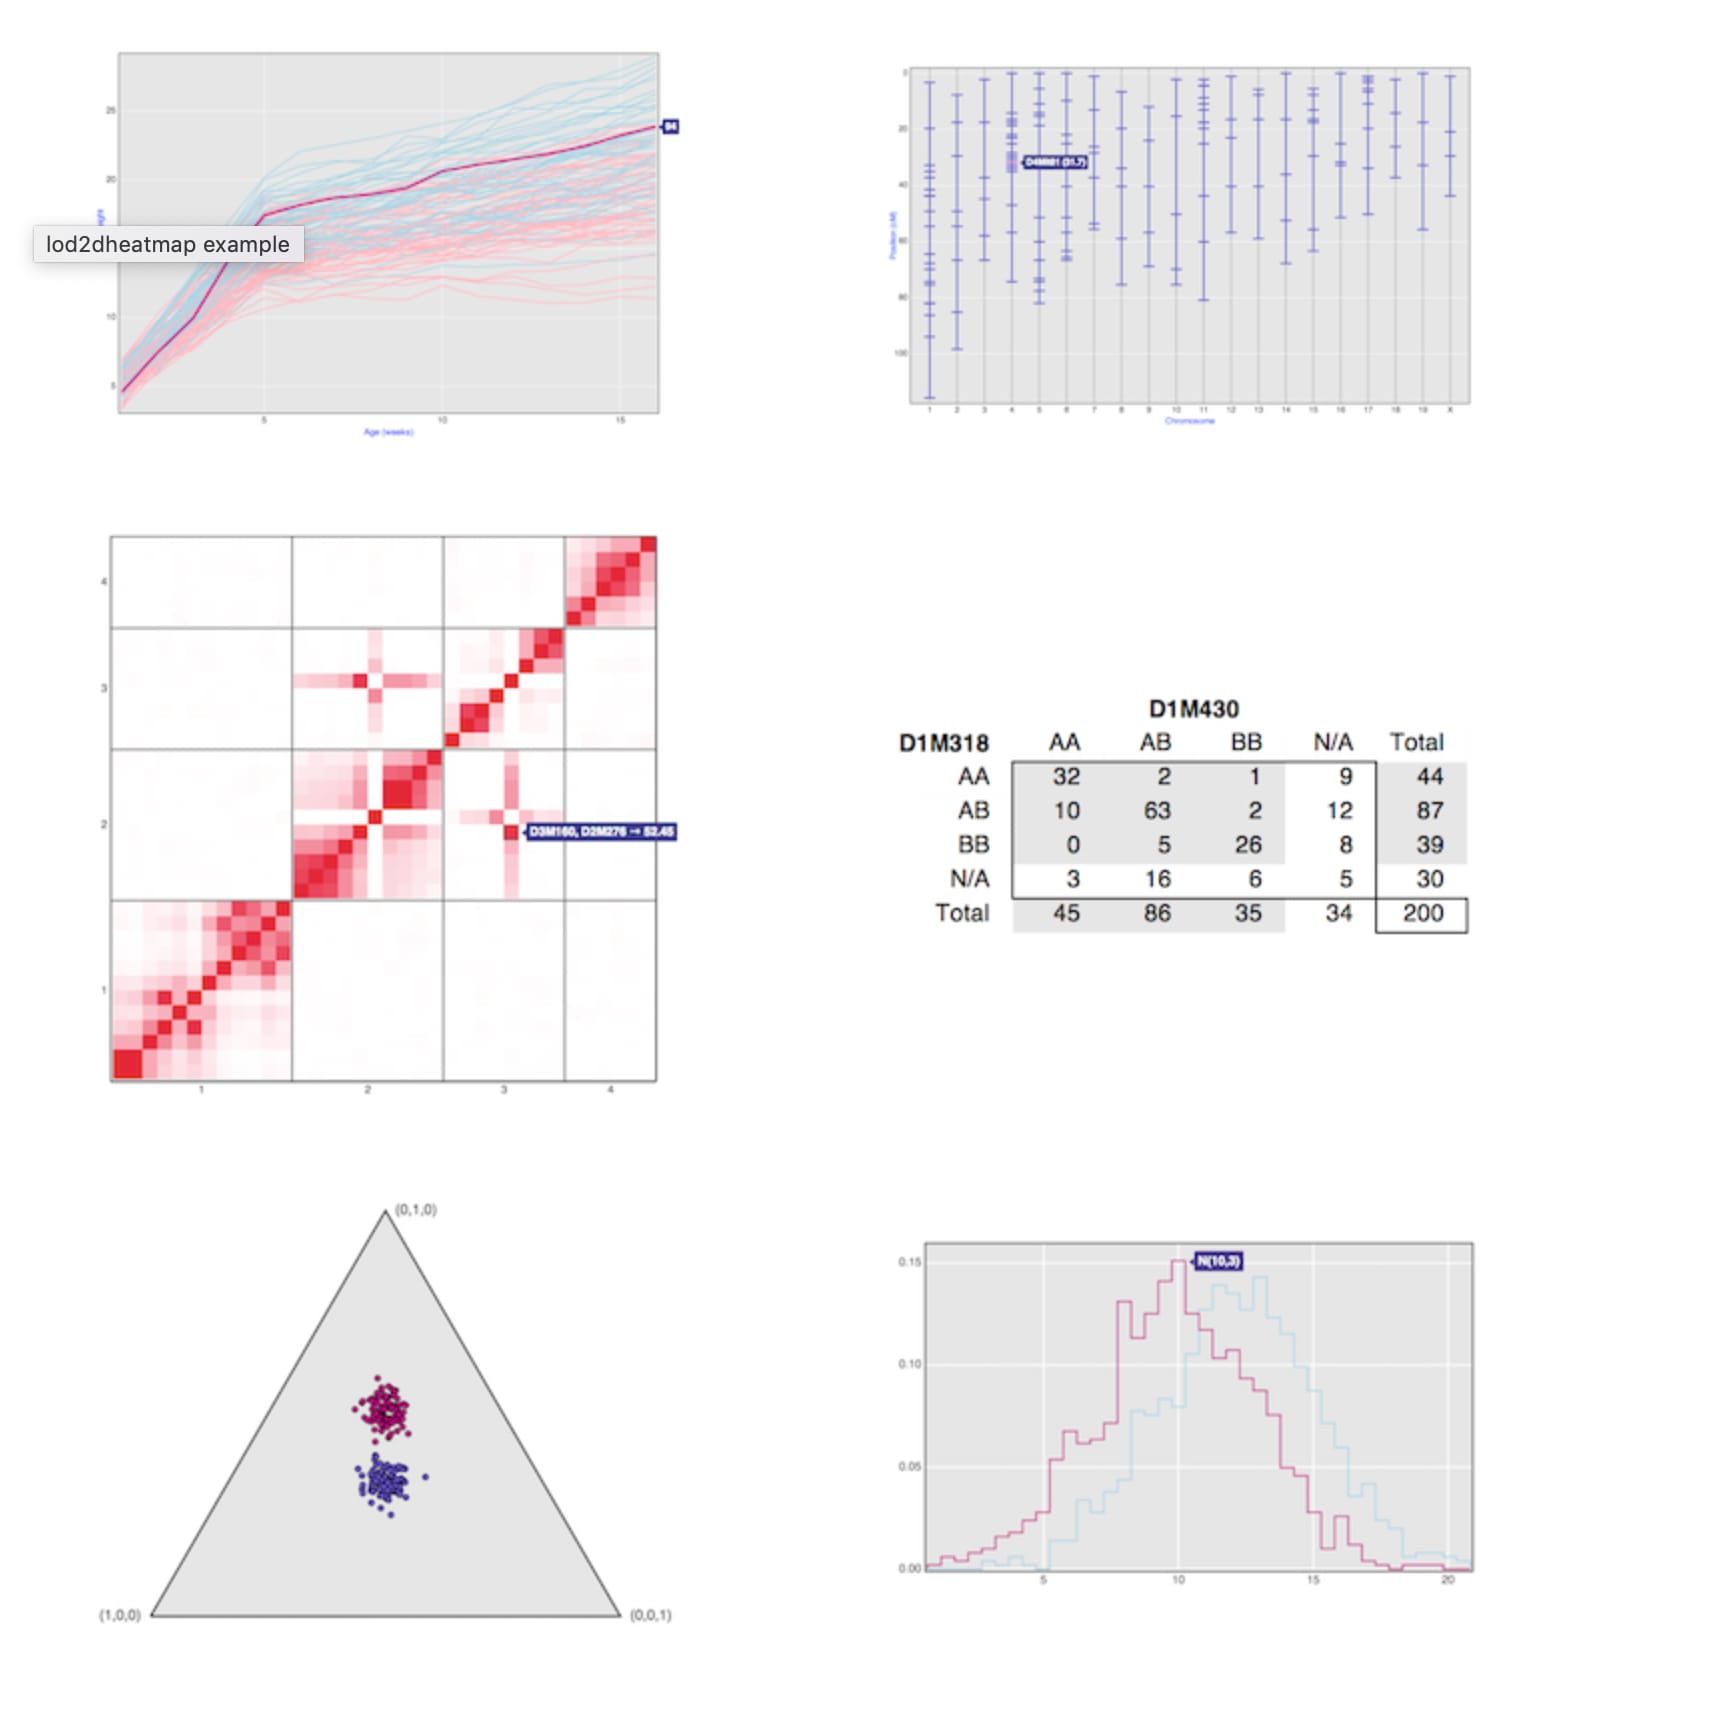
JavaScript/JS D3 statistics statistical small multiples
This is a set of D3-based graphic panels, to be combined into larger multi-panel charts. They were developed for the R/qtlcharts package. Note that d3panels uses D3 version 4.
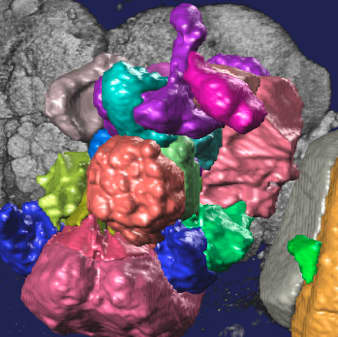
C++ scientific bio brain neurology
Vaa3D visualizes and explores big 3D/4D/5D images with giga-voxels and even tera-voxels, within seconds or sub-seconds! Vaa3D extracts complex surface objects from images, and performs comprehensive analyses such as brain connectome mapping.

JavaScript/JS D3
Webcharts is a charting library built on top of D3.js that offers a simple way to create reusable, flexible, interactive charts with JavaScript. Charts can be customized with a handful of settings and extended through callback functions. Webcharts can also create sets of controls that are tied to charts to dynamically manipulate chart data, appearance, or behavior.
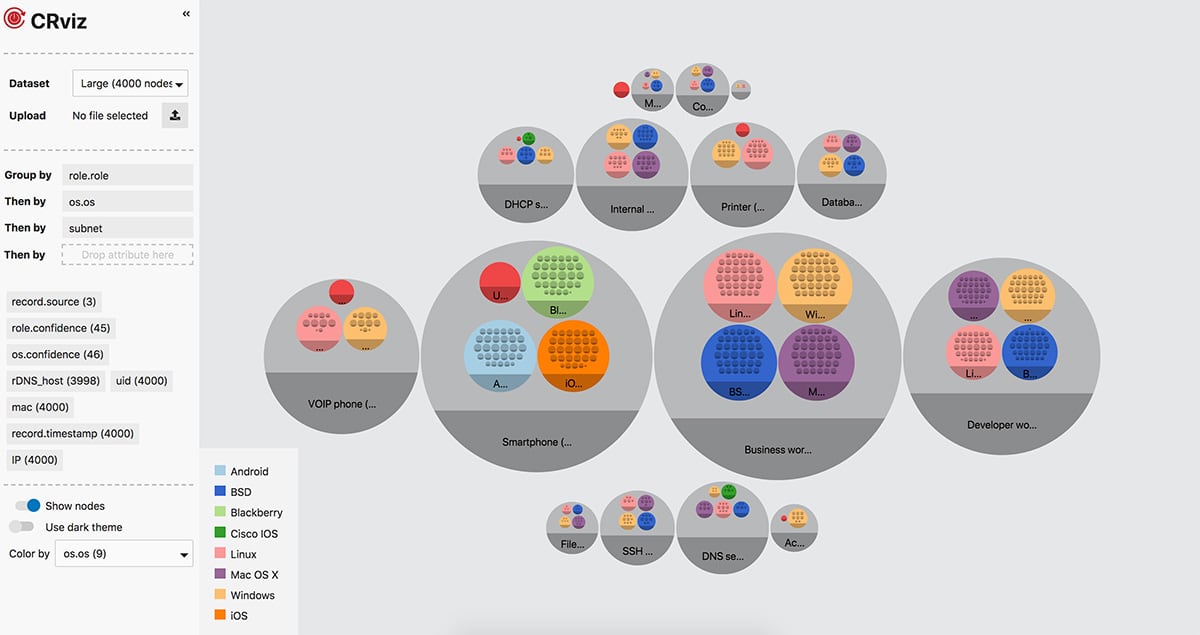
JavaScript/JS D3 security
CRviz is a browser-based visualization tool that uses JSON and an interactive enclosure diagram to visualize networks, utilizing circle-packing methods to display 10,000 or more nodes.

JavaScript/JS D3 tooltip microinteractions µ
D3.js-based annotated tooltip which follows the mouse cursor with window edge collision detection; fully customizable and compatible with TypeScript and JS visualizations.

JavaScript/JS
GeoCommons is a community contributed collection of open data from around the world; includes over 150,000 datasets in GeoJSON format ready for preview, download, and exploration.

Python
Textkit is a set of command line tools for text processing and analysis. With its Unix-style approach, you can use it to perform basic natural language processing (NLP) from the command line.

JavaScript/JS
Built as a small bookmarklet that logs the results of D3.js data joins as you mouse over the graphical elements, allowing you to debug interactively without adding extra console.log() calls.


R-project easy statistics statistical small multiple
Lattice is a powerful and elegant high-level data visualization system for R, inspired by Trellis graphics. It is designed with an emphasis on multivariate data, and in particular allows easy conditioning to produce "small multiple" plots. Lattice is sufficient for typical graphics needs, and is also flexible enough to handle most nonstandard requirements.

JavaScript/JS TypeScript bigdata crossfilter small multiples
Pivot chart is a an extension data visualization type of pivot table. It allows user to observe the data in different chart type without limited to table and pure numbers.
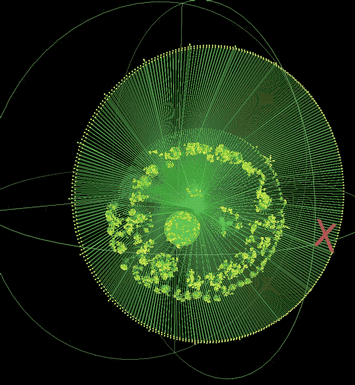
Java SE security bigdata
Walrus is a tool for interactively visualizing large directed graphs in three-dimensional space. It can handle graphs containing anywhere from 100,000 to 1,000,000+ nodes with some occlusion.

geodata C++
ILWIS (The Integrated Land and Water Information System) is a remote sensing and GIS software which integrates image, vector and thematic data in single geovisualization package.

JavaScript/JS No License zoom microinteractions µ
Interactive pan/zoom data visualizations at scale. Kyrix employs a simple client-server architecture. As a visualization developer, you will write a Kyrix specification in Javascript. Kyrix compiler compiles the spec you write and prompts errors if any. The spec is saved in the database and passed to the backend server, which then precomputes necessary database indexes offline to ensure interactive response to online user interactions. The frontend is in charge of listening to user interactions, firing data fetching request to fetch data from the backend, and rendering the visualizations. One great thing about Kyrix is the declarative model it provides. Declarative design hides from you complex execution details such as frontend rendering and backend data fetching logic, and allows you to stay focused on designing your application.

JavaScript/JS
TRAViz (Text Re-use Alignment Visualization) generates text variant graphs that show the variations across different editions of the same text, including alignment, parallelism, and departure.

R-project bio phylogenetic trees
treeio makes it easier to merge and visualize phylogenetic trees along with associated heterogeneous data linked to phylogeny; capable of converting and unifying different file formats.

JavaScript/JS D3
Designed to interpolate ribbon or band areas based on sample points with radii.

JavaScript/JS Java SE
Graphene is a web-based application that provides combined query, visualization, link identification and analysis, and other analytic capabilities within a single system.


JavaScript/JS bio Caleydo omics molecular pathways metabolism
Pathfinder is a tool for the visual exploration of paths in large graphs.
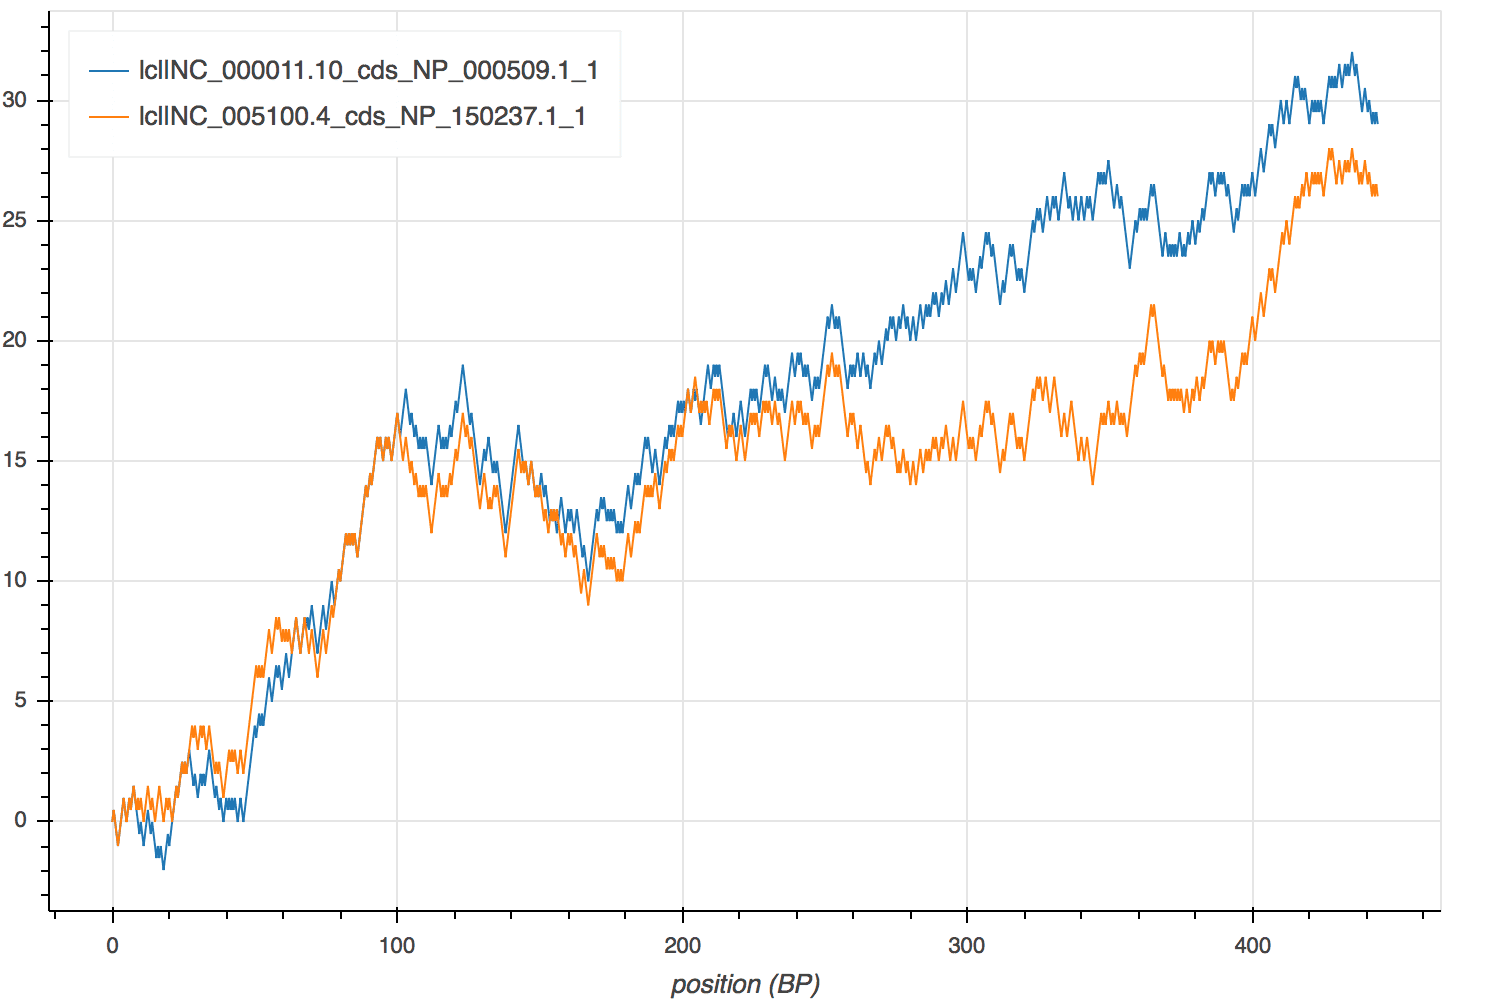
Python bio DNA sequence FASTA
Squiggle is a two-dimensional DNA sequence visualization library that can turn FASTA sequence files into gorgeous, interactive visualizations; requires Python 3.4 or greater.

JavaScript/JS D3
Implement gravitational attraction (or force-field-like repulsion) using d3-force

Python TensorFlow bias fairness ML XAI
Fairness-Indicators is a tool for visualizing binary data using a colour palette. It is in a lot of ways akin to a hexdump tool, except using coloured squares to represent each octet. Fairness-Indicators uses 24-bit color SGR escape sequences.

JavaScript/JS
Khooshe visualizes geospatial data; it gets all point data (latitude and longitude), clusters the points around independently layered centroids, and proceeds until there are no more centroids available.

C++ music audio color fingerprinting
Moodbar is a music visualization method that assigns colors to different parts of a track and presents them as a timeline. Applied to a music player, the main goal is to help the user navigate within a particular track. For example, if the user wants to skip to the first chorus of a song, a good moodbar implementation should be able to provide a hint of where this might occur in the timeline.

JavaScript/JS topic summarization content natural language processing NLP
SerendipSlim is a reorderable matrix visualization tool designed to help researchers explore large collections of text documents at the corpus level with probabilistic topic modeling.

geodata
GeoTemCo visualizes data according to several dimensions: geospatial distribution of items (in map view), temporal distribution (time view), and individual item properties (detail view).

TypeScript JSON
This javascript module aims at providing an easy interface in order to represent tree diagrams on screen with the ability to handle dynamic data flows. The data format must be JSON.

Python annotate annotations video audiovisual AV dubbing subtitles random
Advene (Annotate Digital Video, Exchange on the NEt) helps users annotate digital video documents from movies, clips, courses, and conferences, and exchange multimedia-linked comments.

JavaScript/JS D3 time series quality statistical
d3 utility to apply nelsons rules of process control to a set of data

JavaScript/JS time series financial
Jenscript is a JavaScript HTML5/SVG library for visualization and charting in web modern browsers. Jenscript provides most of commons charts like pie, donuts, lines, spline, scatter, stocks, bar symbols, gantt, ray, metrics and tools like zoom, pan, widgets and projections selectors. Jenscript is available as a standalone file or a set of plugin libraries.

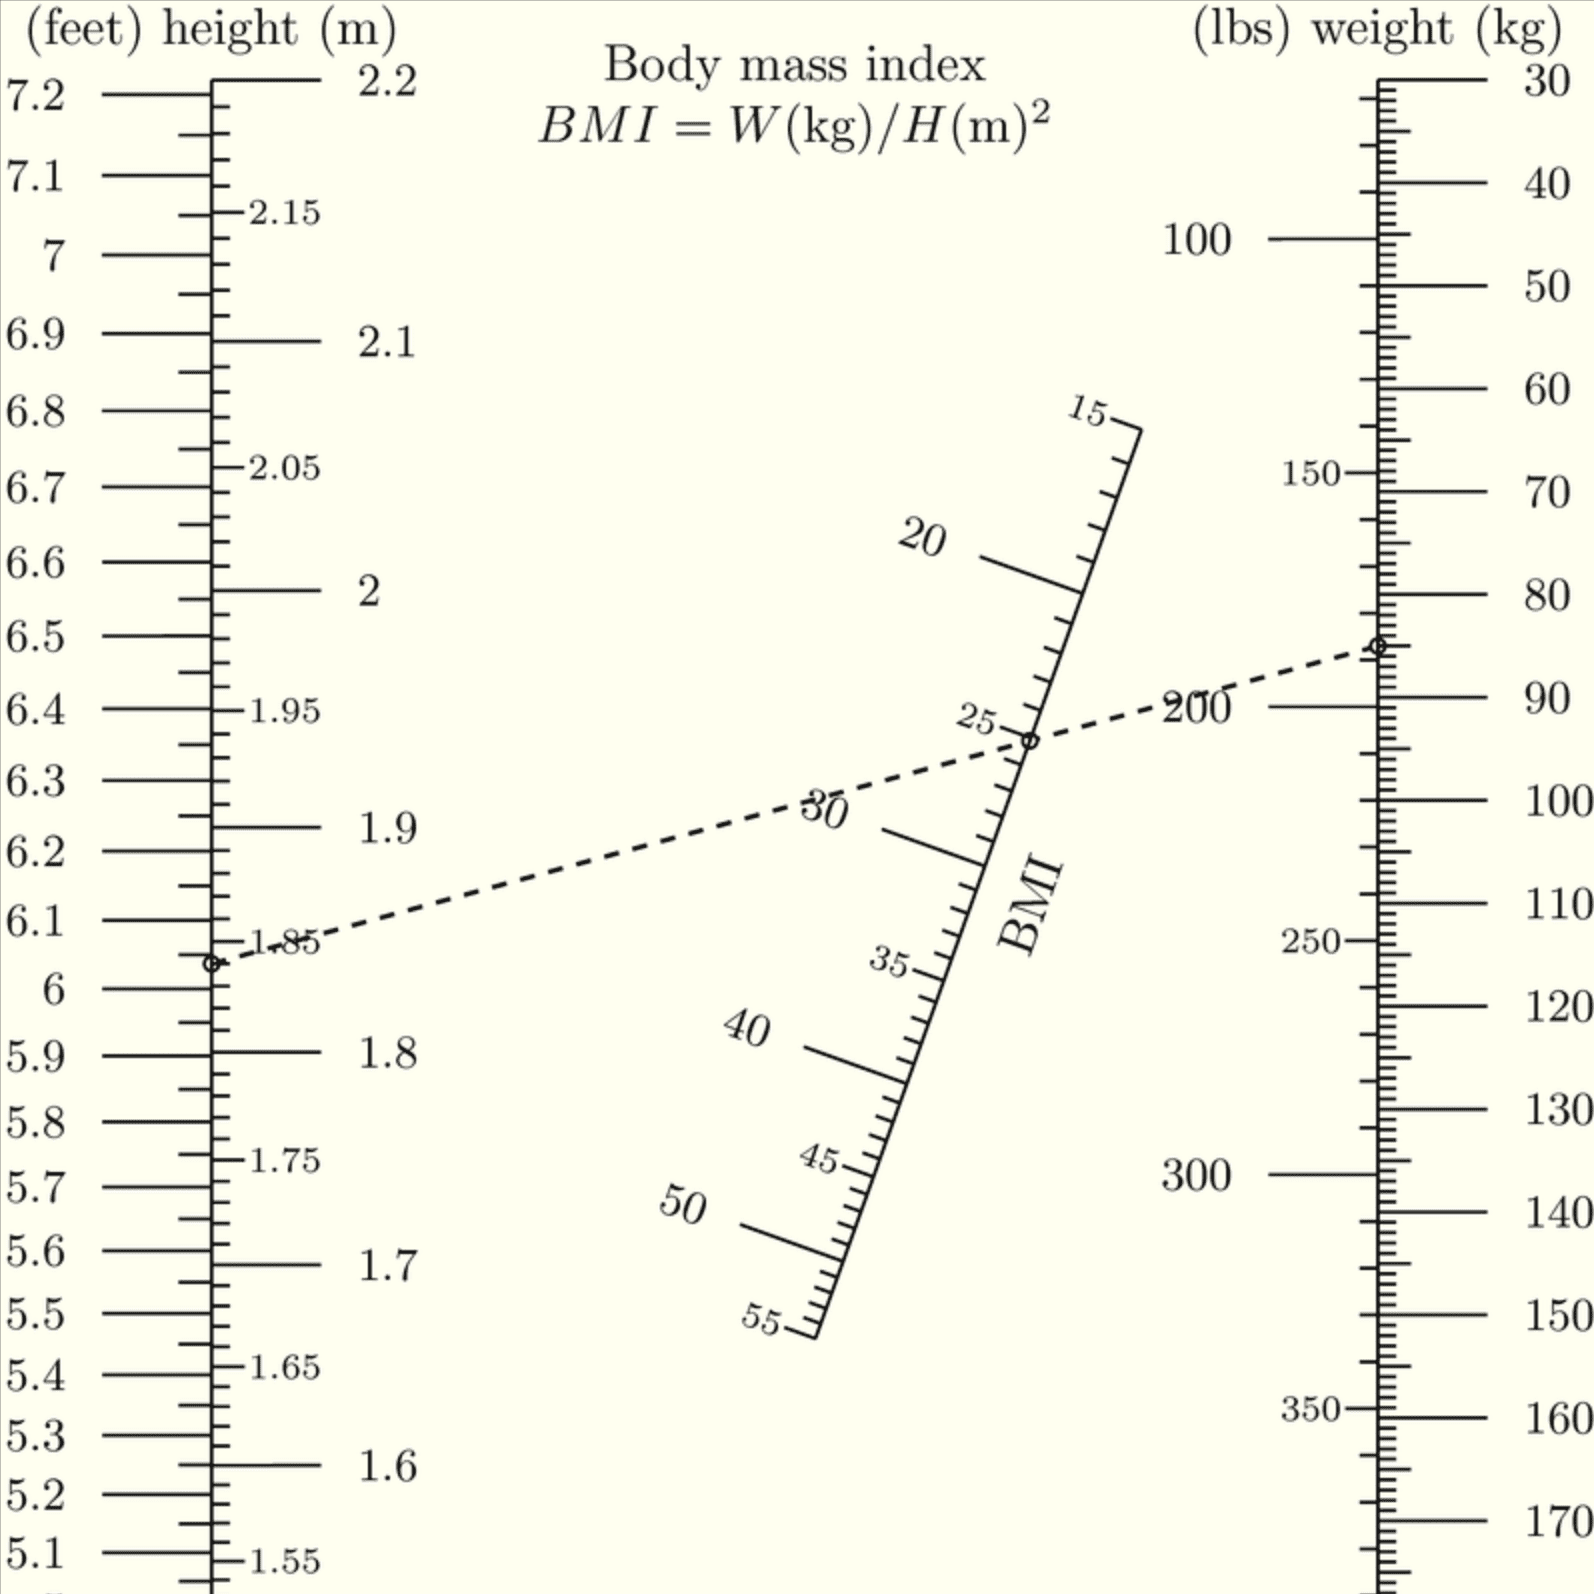
Python nomogram mathematics mathematical random
PyNomo draws precision nomograms (graphical calculating devices) in PDF or EPS format. It supports nine basic nomograms base on the format of the equation, with no need to convert or reconfigure most standard functions.

JavaScript/JS vote voting elections electoral
An interactive contiguous cartogram for visualizing geographical data. Given a TopoJSON topology, renders its shapes with distorted areas according to a value associated with each feature.
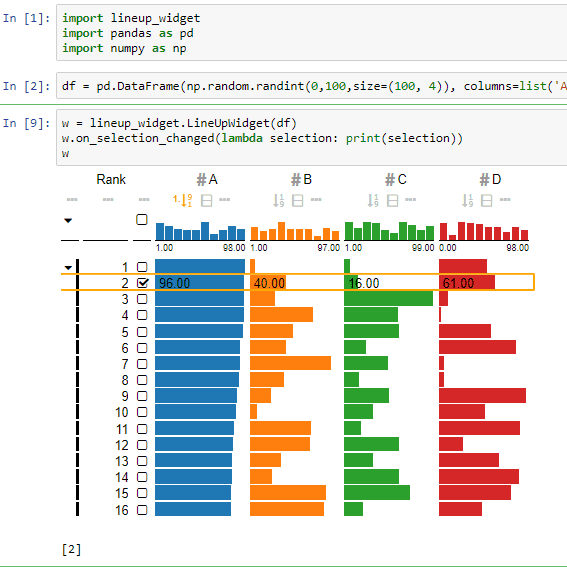
TypeScript
LineUp is an interactive technique designed to create, visualize and explore rankings of items based on a set of heterogeneous attributes.
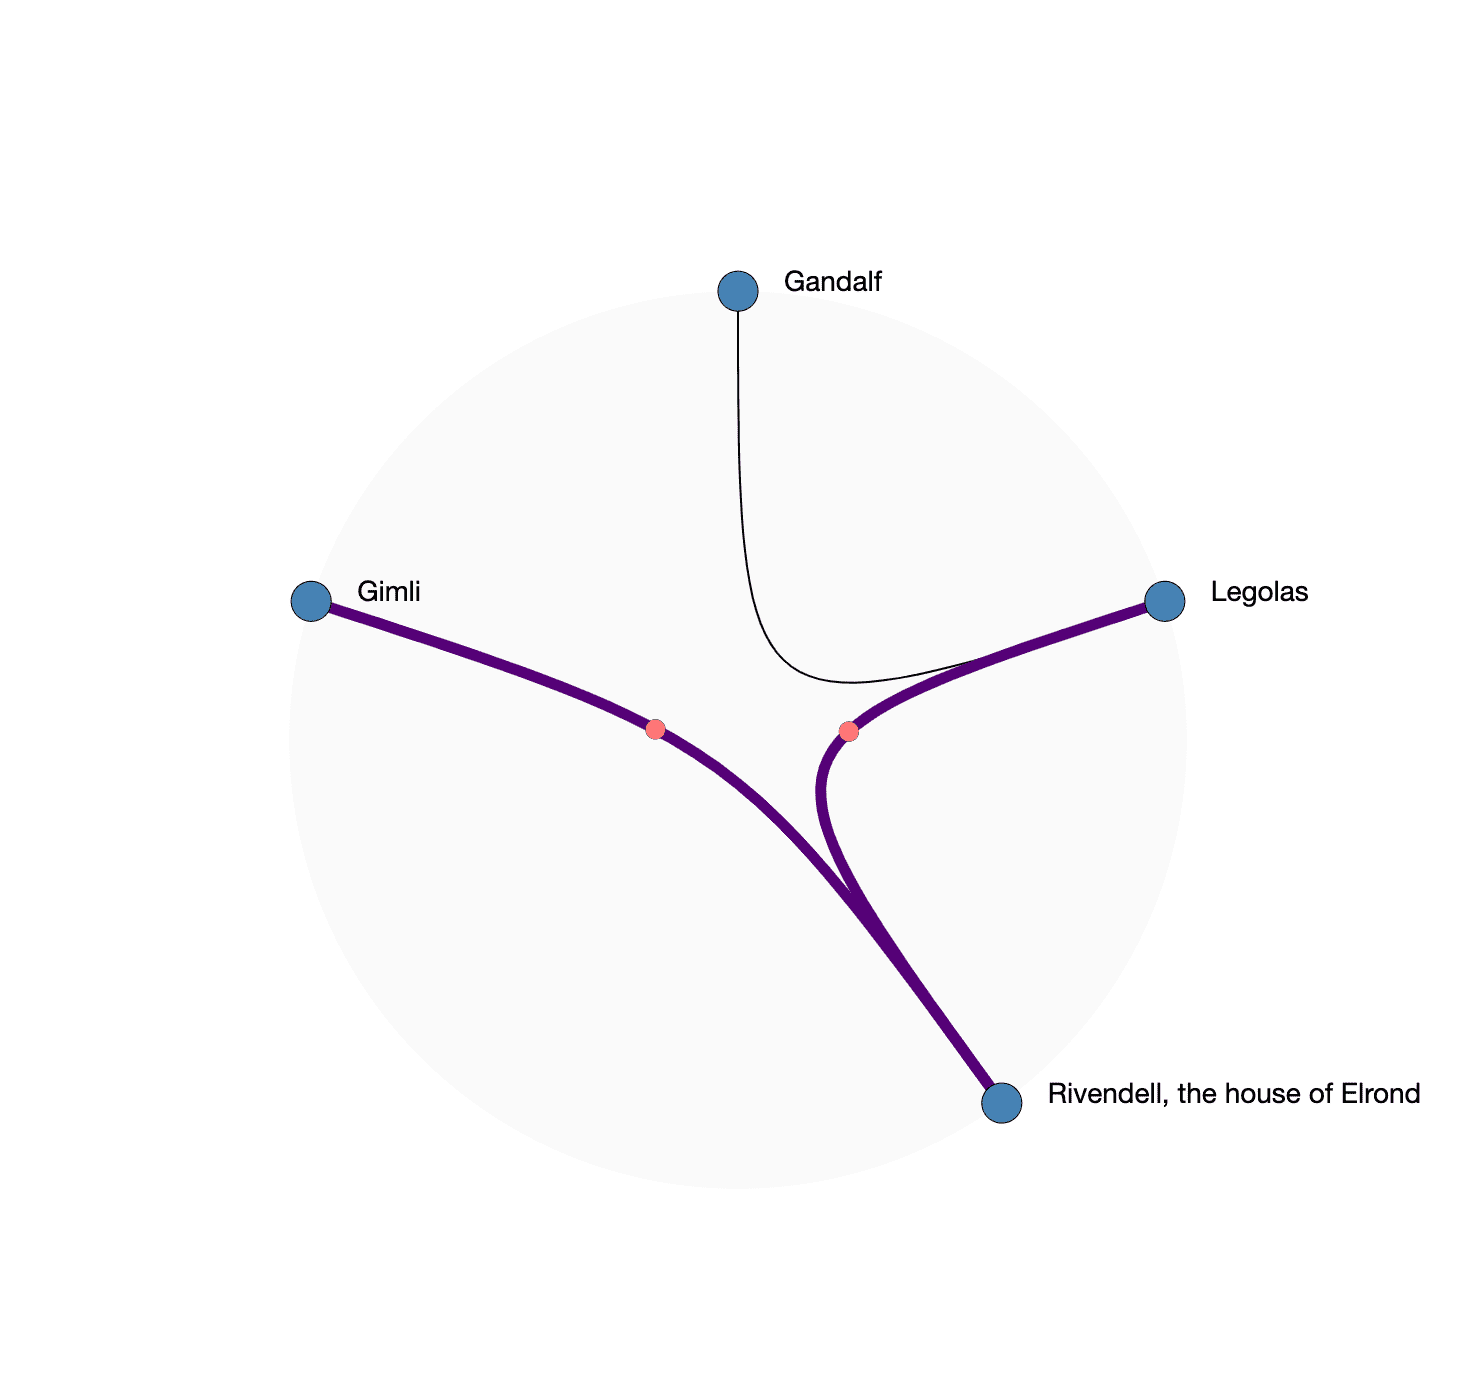
JavaScript/JS cryptocurrency financial
NetVis is a highly customizable Javascript framework for building interactive network activity visualizations (including IP, TCP, HTTP, TSL, BitCoin, IPFS, and communication in other protocols).

JavaScript/JS jQuery word clouds wordclouds
Tagcloud is a lightweight jQuery plugin that visualizes the <li> tagged contents of unordered lists as animated 3D spherical tag clouds which respond to user events/mouse movements.
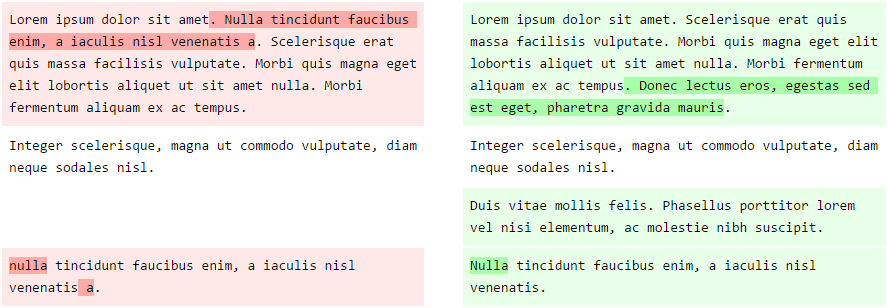
PHP diffchecker highlighting
Written in PHP and based on Wordpress's Compare Revisions capability, TextDiff is a simple split-view, text difference visualization library that can handle extended strings.


JavaScript/JS jQuery sparklines D3
A simple jQuery and D3.js library that creates small inline word-scale visualizations (including, but not limited to, sparklines, line charts, and bar charts) with extensive customization.

Java SE named entity extraction content natural language processing NLP highlighting
Vizlinc takes a corpus of text documents, extracts named entities (people, locations, and organizations) and visualizes the relationships between those entities from the documents.
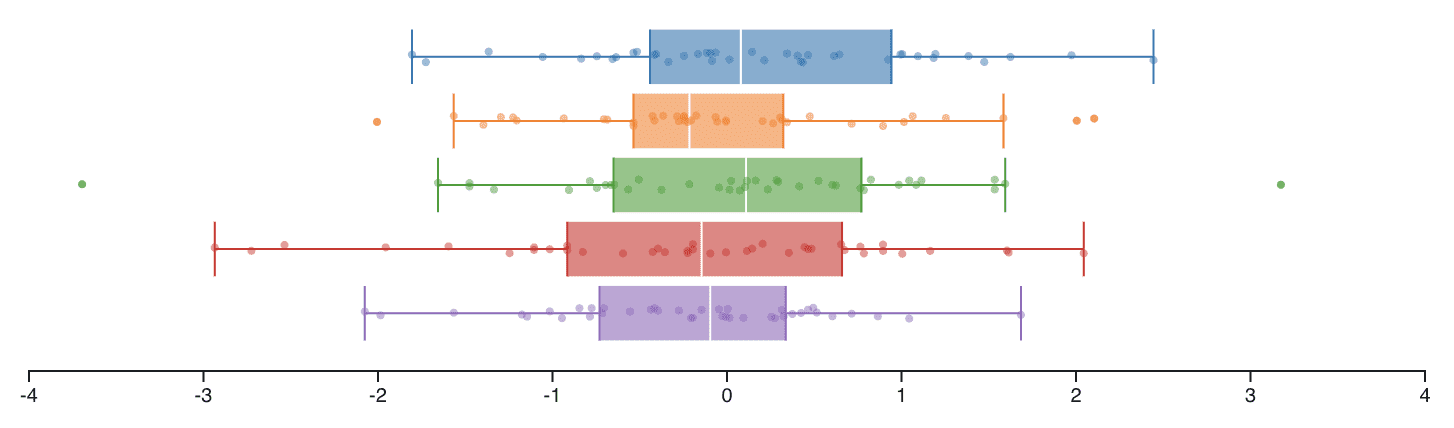
JavaScript/JS D3 statistics statistical box and whisker

JavaScript/JS
Track Communities provides data analysts a platform to explore communities of co-occurring tracks (or paths) of movement; visualize paths on a map, and observe where and when inferred tracks intersect.

Ruby Docker
Every network tells a story. Build one quickly and easily to tell yours. Fill the table and the network will pop up. Or import your own file and in two steps you will have your visualization ready.

Python highlighting
Textcatvis visually analyzes a collection of texts and highlights keywords for each class, individual text, or identified cluster (to better understand NLP classifier decisions).

JavaScript/JS D3 flu epidemic infectious diseases forecasting bio
D3 Foresight is a d3 based library for visualizing time series forecasts interactively.
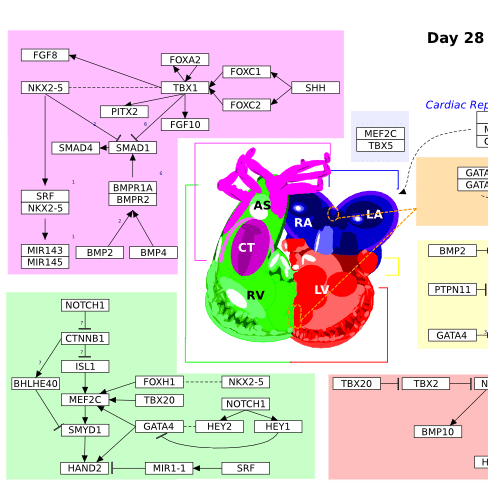
Java SE molecular pathways metabolism omics genetic bio
PathVisio is a free open-source biological pathway analysis software that allows you to draw, edit and analyze biological pathways; multiple plugins available for data integration and analysis.

JavaScript/JS jQuery random culture cultural typography
A jQuery plugin for making random David Carson-inspired word art in the <canvas>. Enables the designer to adjust speed, font variety, width, height, color, complexity, and randomization.

TypeScript Caleydo juxtaposition
TACO is an interactive comparison tool that visualizes effectively the differences between multiple tables at various levels of detail. With TACO we show (1) the aggregated differences between multiple table versions over time, (2) the aggregated changes between two selected table versions, and (3) detailed changes between the selection.

Python content natural language processing NLP
Textable is an open source add-on bringing advanced text-analytical functionalities to the Orange Canvas data mining software package. Check out the examples to see it in action.

Java SE content natural language processing NLP
A radial, space-filling layout of hyponymy (IS-A relation) is presented with interactive techniques of zoom, filter, and details-on-demand for the task of multi-document visualization.

JavaScript/JS bio phylogeny homology genetic
Aequatus Browser: Visualising complex similarity relationships among species

Java SE financial time series bigdata
Glimpse is a library for building dynamic, interactive Java applications for visualizing Big Data.

R-project
iNZight as a whole is a simple data analysis system which encourages exploring what data is saying without the distractions of driving complex software. While it was initially designed for New Zealand high schools, iNZight now extends to multivariable graphics, time series and linear models.

C Python
PyGraphviz is a Python interface to the Graphviz graph layout and visualization package. With PyGraphviz you can create, edit, read, write, and draw graphs using Python to access the Graphviz graph data structure and layout algorithms.

JavaScript/JS Sentence Drawings in D3 literature literary culture cultural random
Based on Stefanie Posavec's Sentence Drawings, this auto-generated D3.js series can be used to visualize the word count, structure, and thematic content of a given literary work.

Java SE gene genetic bio
BioTapestry is an interactive tool for building, visualizing, and simulating genetic regulatory networks and models of biological systems that exhibit increasing complexity over time.

JavaScript/JS D3 tooltip microinteractions µ
Simple, beautiful data-driven tooltips with dynamic resizing, multiple visual attributes, and several customization options, including display and hiding based on specific user events.
JavaScript/JS No License juxtaposition steganography
This is a simple plugin to create a before/after image that responds to mouse movement as well as touch movements.

Python source code typography microinteractions µ syntax highlighting
Pygments is a syntax highlighter that supports over 300 languages and other text formats, with a simple regex-based lexing mechanism; usable as a command-line tool and as a library.

Python highlighting natural language processing NLP highlighting
A simple textual heatmapping tool that ingests a JSON file containing words, weights, labels, and predictions; visualizes recurrent neural network attention weights on the document.

JavaScript/JS natural language processing NLP sentence diagramming treebanks
Parse, diagram, and visualize English language texts of your choosing; double-clicking on the phrase diagram both changes the view and alters the node structure of the visualization.

EDEN is an interactive visual analytics tool for exploring quantitative multivariate data. EDEN is written in Java and runs on Mac OS X, Windows, and Linux operating systems. EDEN is developed and maintained by the Oak Ridge National Laboratory Computational Data Analytics Group. The lead developer is Chad A. Steed.
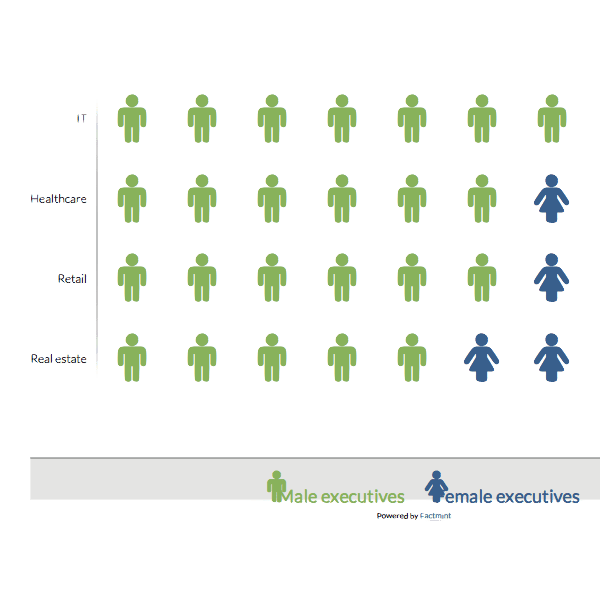
JavaScript/JS counter
Factmint Charts allows you to create interactive data visualizations, which can be rendered from an HTML table or directly from JSON.
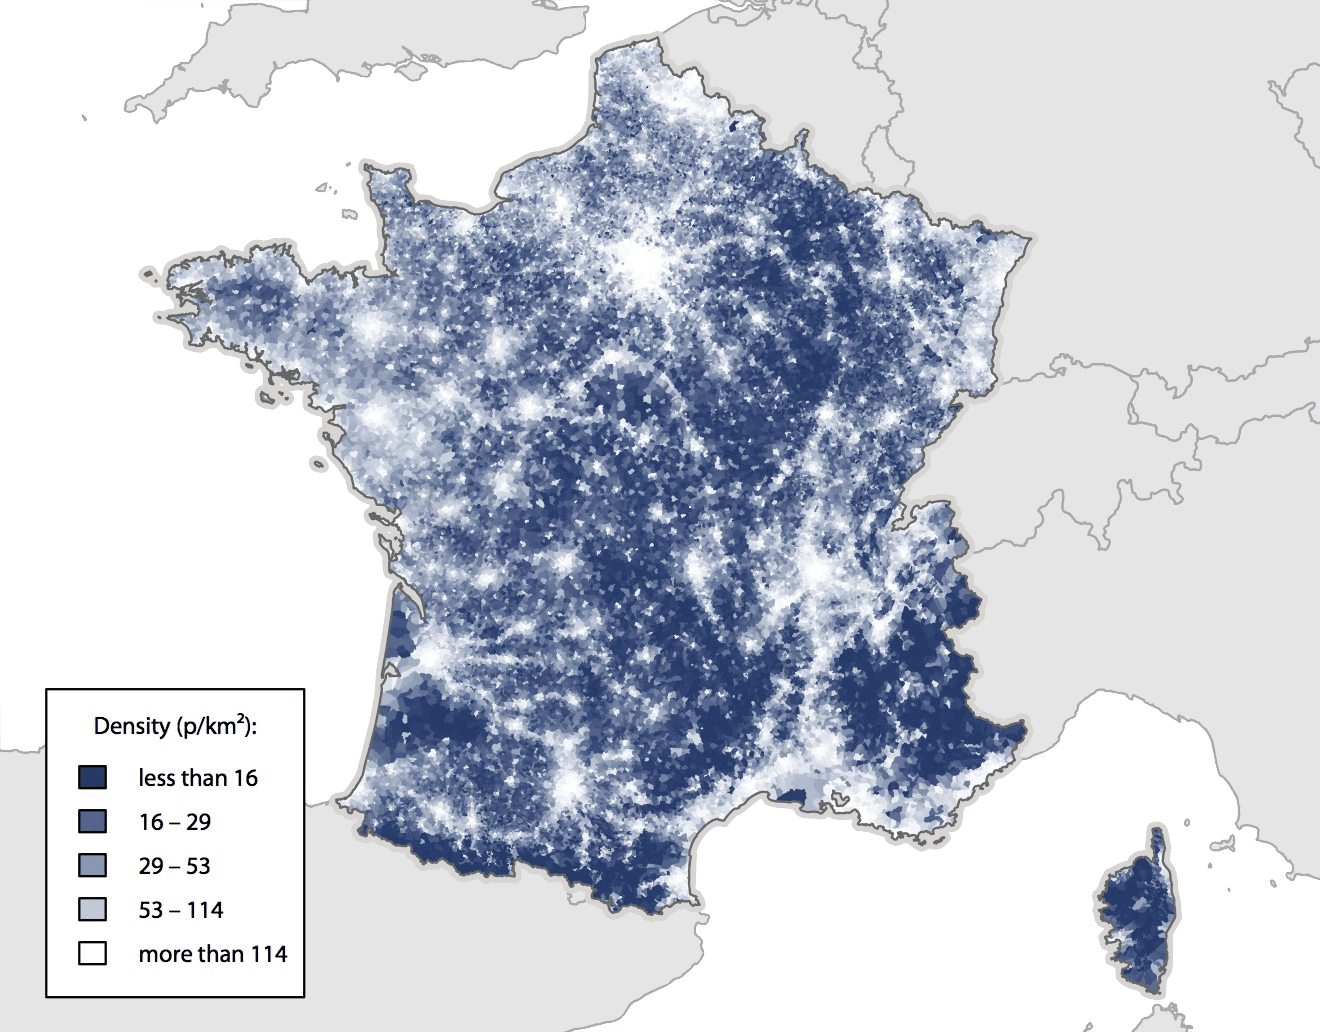
R-project GDAL raster
Provides bindings to the 'Geospatial' Data Abstraction Library ('GDAL') (≥1.11.4 and ≤2.5.0) and access to projection/transformation operations from the 'PROJ.4' library.
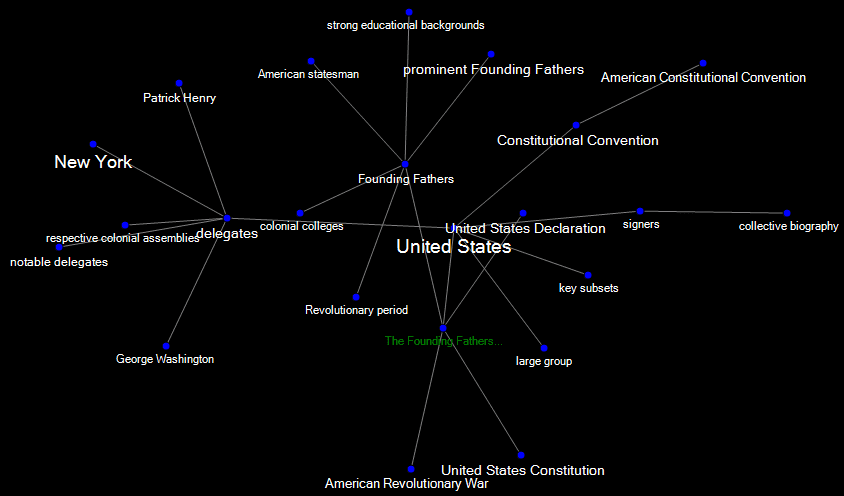
C# natural language processing NLP
Visualize keyword graphs and dictionary value clusters from a given URL. This tool is subject to the IBM AlchemyAPI rate limit of 1,000 natural language processing (NLP) queries per day.

Python content natural language processing NLP
TAPoR can conduct Multiple Correspondence Analysis (MCA) on a given corpus, clean and break the text down into individual tokens, and then plot the results on a scatter plot.

Python content topic summarization natural language processing NLP D3
TWiC Close Reading (TCR) is a Python script that generates multiple interactive views of texts, including topic weights in each text and topic word weights within their corresponding topics.

JavaScript/JS easy biochemistry biochemical protein
MolArt is a responsive, easy-to-use JavaScript plugin which enables users to view annotated protein sequence (including variation data from large scale studies) and overlay the annotations over a corresponding experimental or predicted protein structure. It couples protein sequence annotation capabilities provided by ProtVista (or more precisely its modified responsive version implemented when developing MolArt) with structure visualization capabilities provided by LiteMol. Since it does not have any software dependencies and all the data are obtained on the fly, it is easy to integrate it to any web page.

R-project epidemic infectious diseases bio
Epiflows is a collection of tools for analyzing and visualizing epidemiological flows between locations.

C scientific
OpenDX stands for Open Data Explorer and is IBM's scientific data visualization software. It can handle complex domains (such as a mechanical gear or a human brain) along with measured or computed data. The data may be scalar (such as the concentration of a chemical agent in the brain), vector or tensor fields (like the displacement or strain tensor fields when the gear is in action) at different points of the object. The points at which data is measured don't have to be equally spaced, and not need to be homogeneously spaced.

JavaScript/JS content natural language processing NLP cultural highlighting tf-idf
TextArc visualizes a text as two concentric spirals on the screen, with each word rendered in a small font around the outside, and a larger, more legible set of frequently used words at center.

R-project epidemic infectious diseases bio
Epicontacts is a collection of tools for analyzing and visualizing epidemiological contact data.

JavaScript/JS jQuery summary mini map navigation microinteractions µ
A simple jQuery plugin that adds a thumbnail summary of a Web page's visible area relative to its full content, akin to Sublime Text's corner minimap; uses the HTML5 <canvas> element.

Python munging wrangling cleaning preparation
Extracts place names and locations from a text corpus and generates a bubble map visualization using a combination of cartopy, pandas, NLTK, and the Stanford CRFClassifier for NER.

C++ No License parallel coordinates
XmdvTool is a public-domain software package for the interactive visual exploration of multivariate data sets. It is available on all major platforms such as UNIX, LINUX, MAC and Windows. XmdvTool is developed using Qt and Eclipse CDT. It supports five methods for displaying flat form data and hierarchically clustered data:
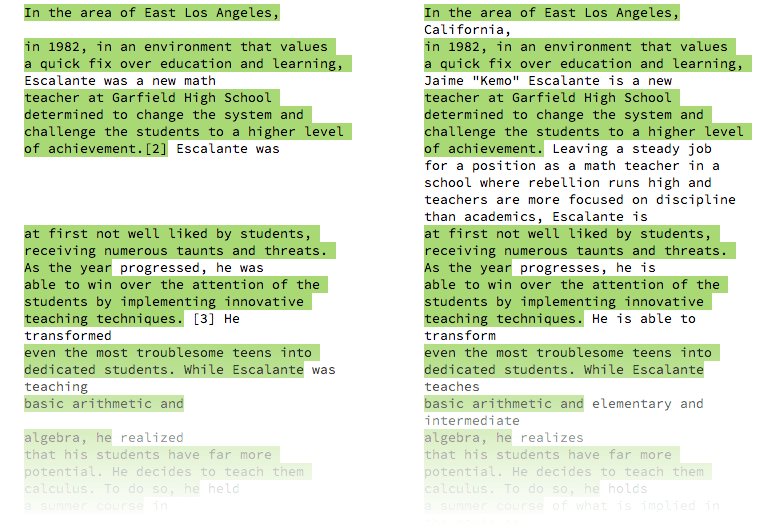
JavaScript/JS jQuery natural language processing NLP summarization diffchecker highlighting
A small widget for visualizing the difference between two texts, including duplication and text reuse; includes optional content, length, and wrap parameters; uses the diff_match_patch library.
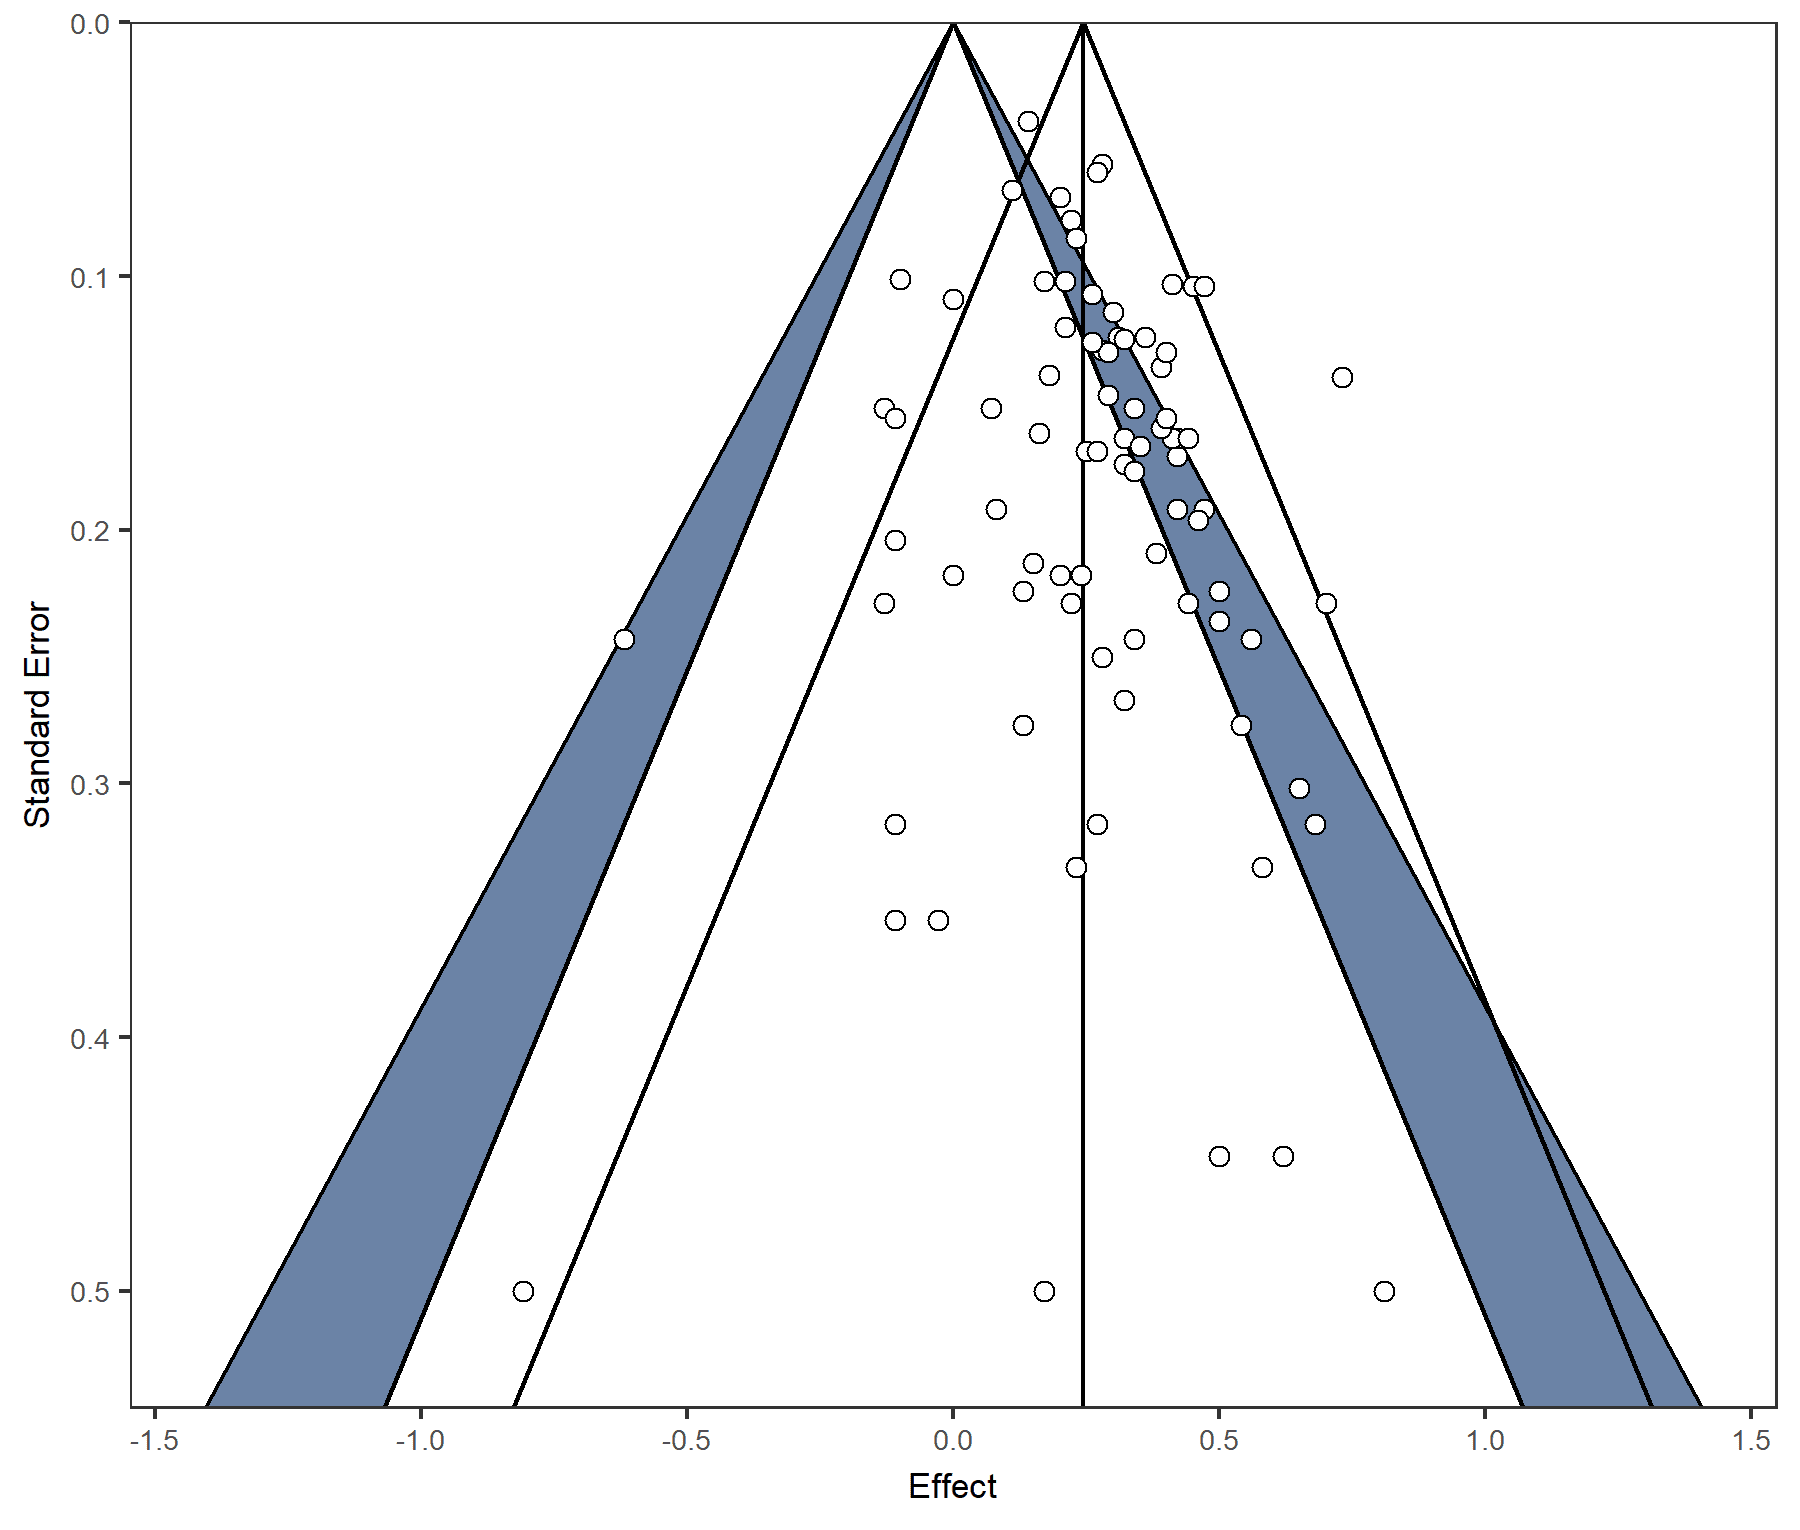
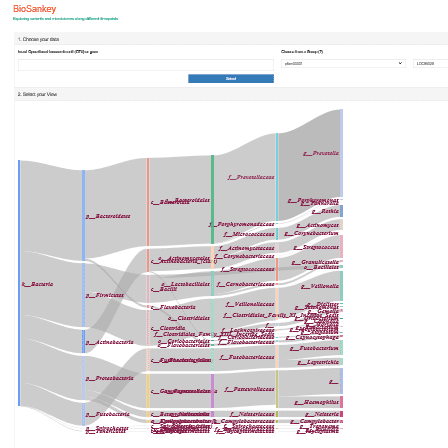
Python genetic bio Sankey
BioSankey is a tool for generating Sankey plots from biological data either by using gene expression counts or the relative abundances of microbial species changing over time.


R-project
Interface to Geometry Engine - Open Source ('GEOS') using the C 'API' for topology operations on geometries; when installing this package from source, make sure to preinstal the 'GEOS' library.

R-project GL
rgl: 3D Visualization Using OpenGL Provides medium to high level functions for 3D interactive graphics, including functions modelled on base graphics (plot3d(), etc.) as well as functions for constructing representations of geometric objects (cube3d(), etc.). Output may be on screen using OpenGL, or to various standard 3D file formats including WebGL, PLY, OBJ, STL as well as 2D image formats, including PNG, Postscript, SVG, PGF.

JavaScript/JS D3 simulated annealing microinteractions µ
A D3.js layout that places labels, arranges components based on their rectangular bounding boxes, and avoids overlaps using either a greedy or simulated annealing strategy.
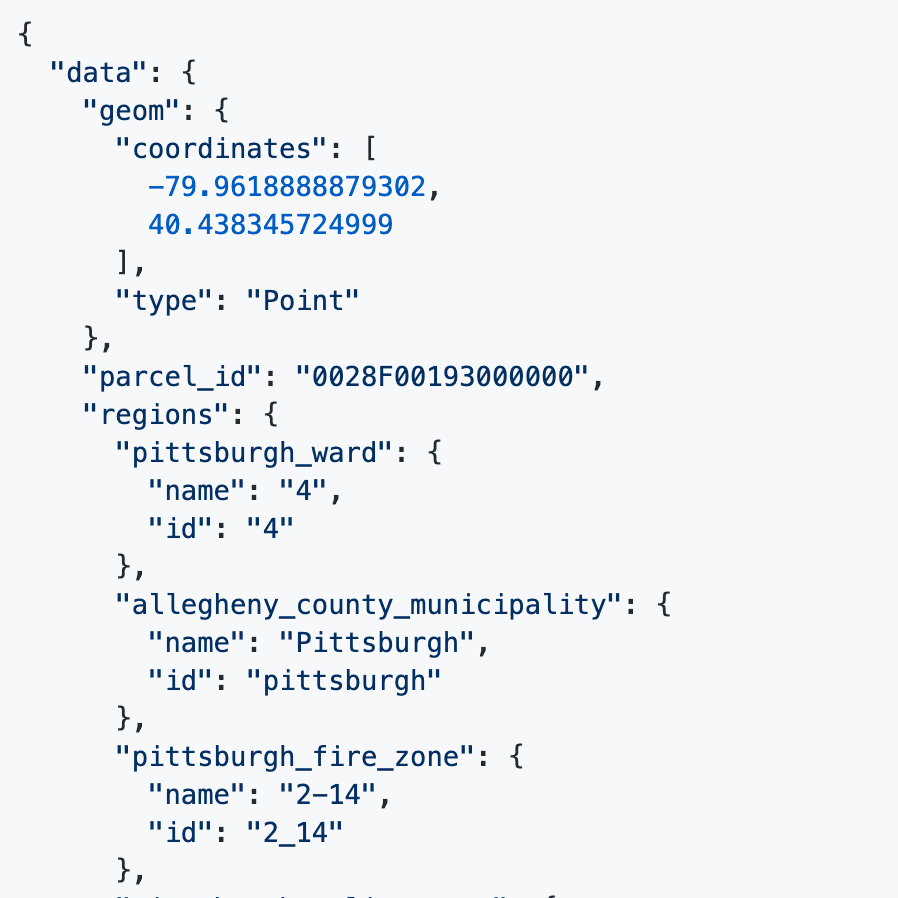
Python
A set of GIS services for geographical data; lists administrative region types and regions, maps a street address to latitude and longitude, performs reverse geocoding, and queries parcel IDs.


JavaScript/JS D3 word clouds wordclouds
TagPies can visualize co-occurrences of multiple keywords as well as genre tags, allowing both distant readings of the results of keyword searches and close readings of the texts themselves.
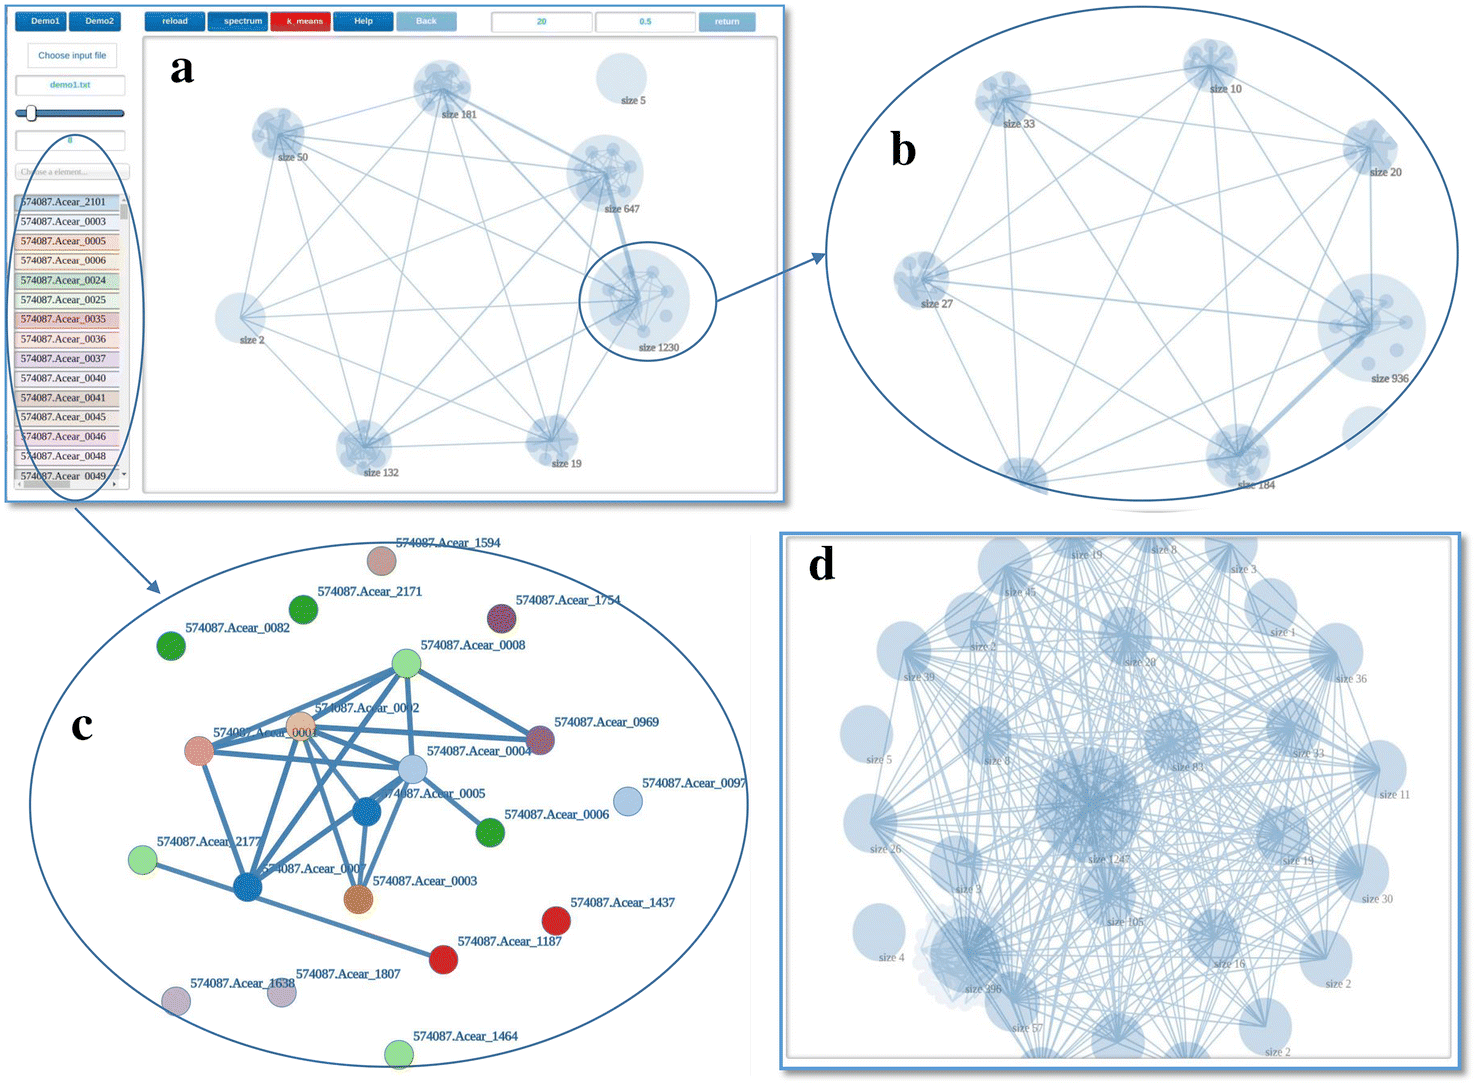
JavaScript/JS bio
Built with Electron, HiVis provides a hierarchical view of network data with a zoom-in or zoom-out function powered by k-means and fast approximate spectral clustering algorithms.
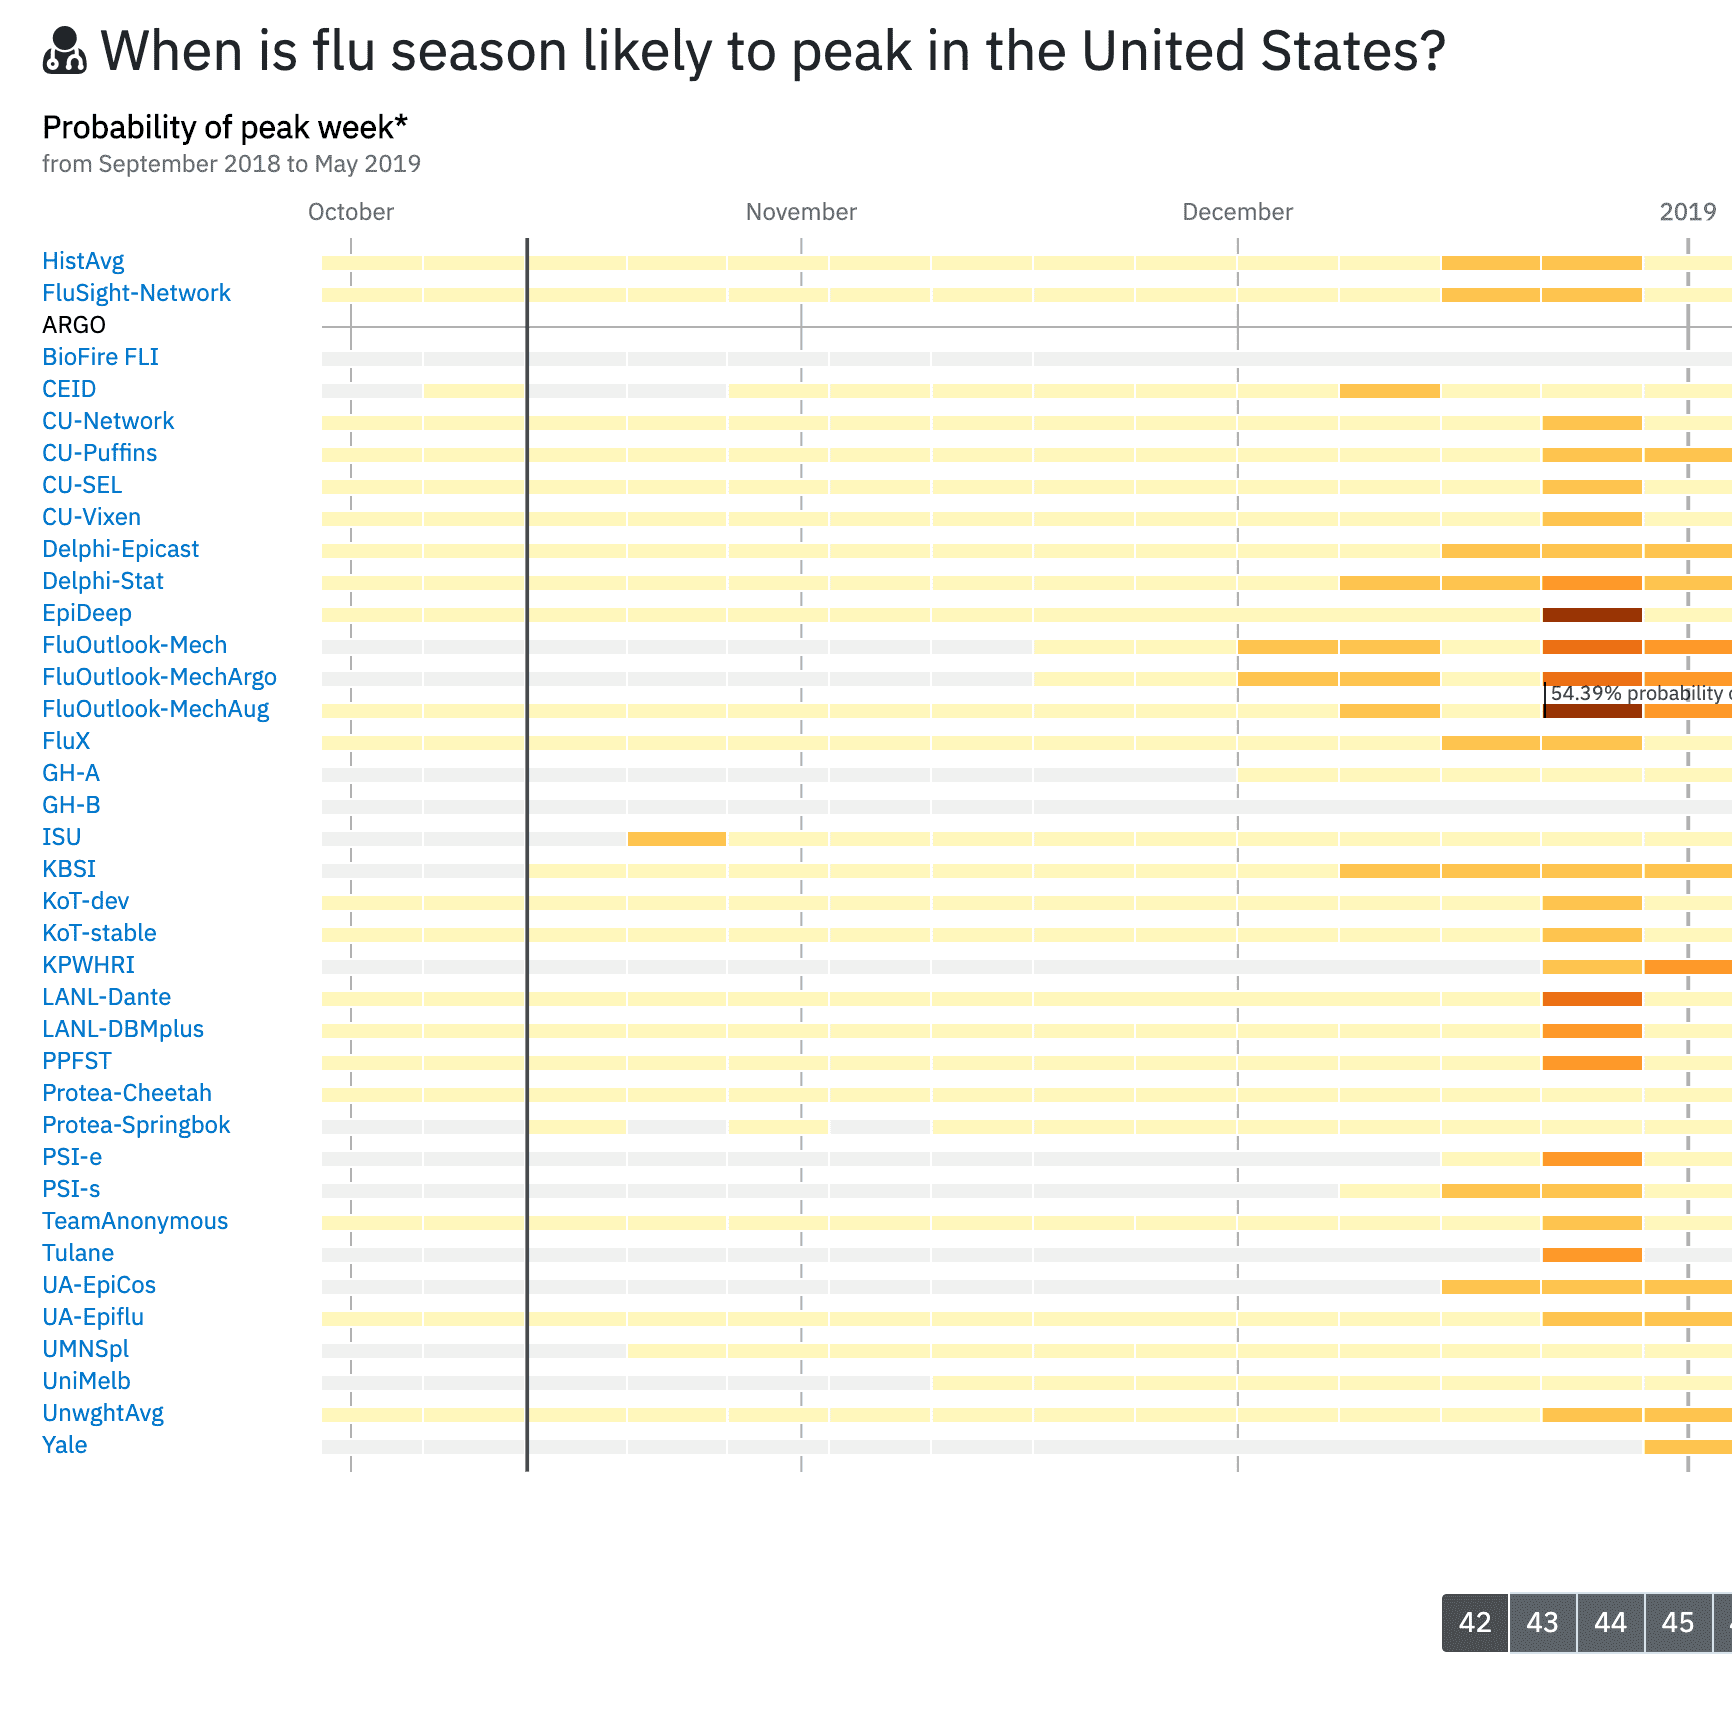
JavaScript/JS D3 flu epidemic infectious diseases forecasting bio
Viziflu is a visualization tool that displays multiple predictions about the timing of "U.S. National"/"Peak Week," the week with the highest predicted number of flu cases, using the results of forecasts submitted to the Centers for Disease Control and Prevention (CDC) as part of the agency's annual FluSight influenza forecasting challenge. By displaying the outputs of multiple influenza models and allowing users to compare the uncertainty across those models, Viziflu can help make influenza forecasts more actionable for decision-makers.
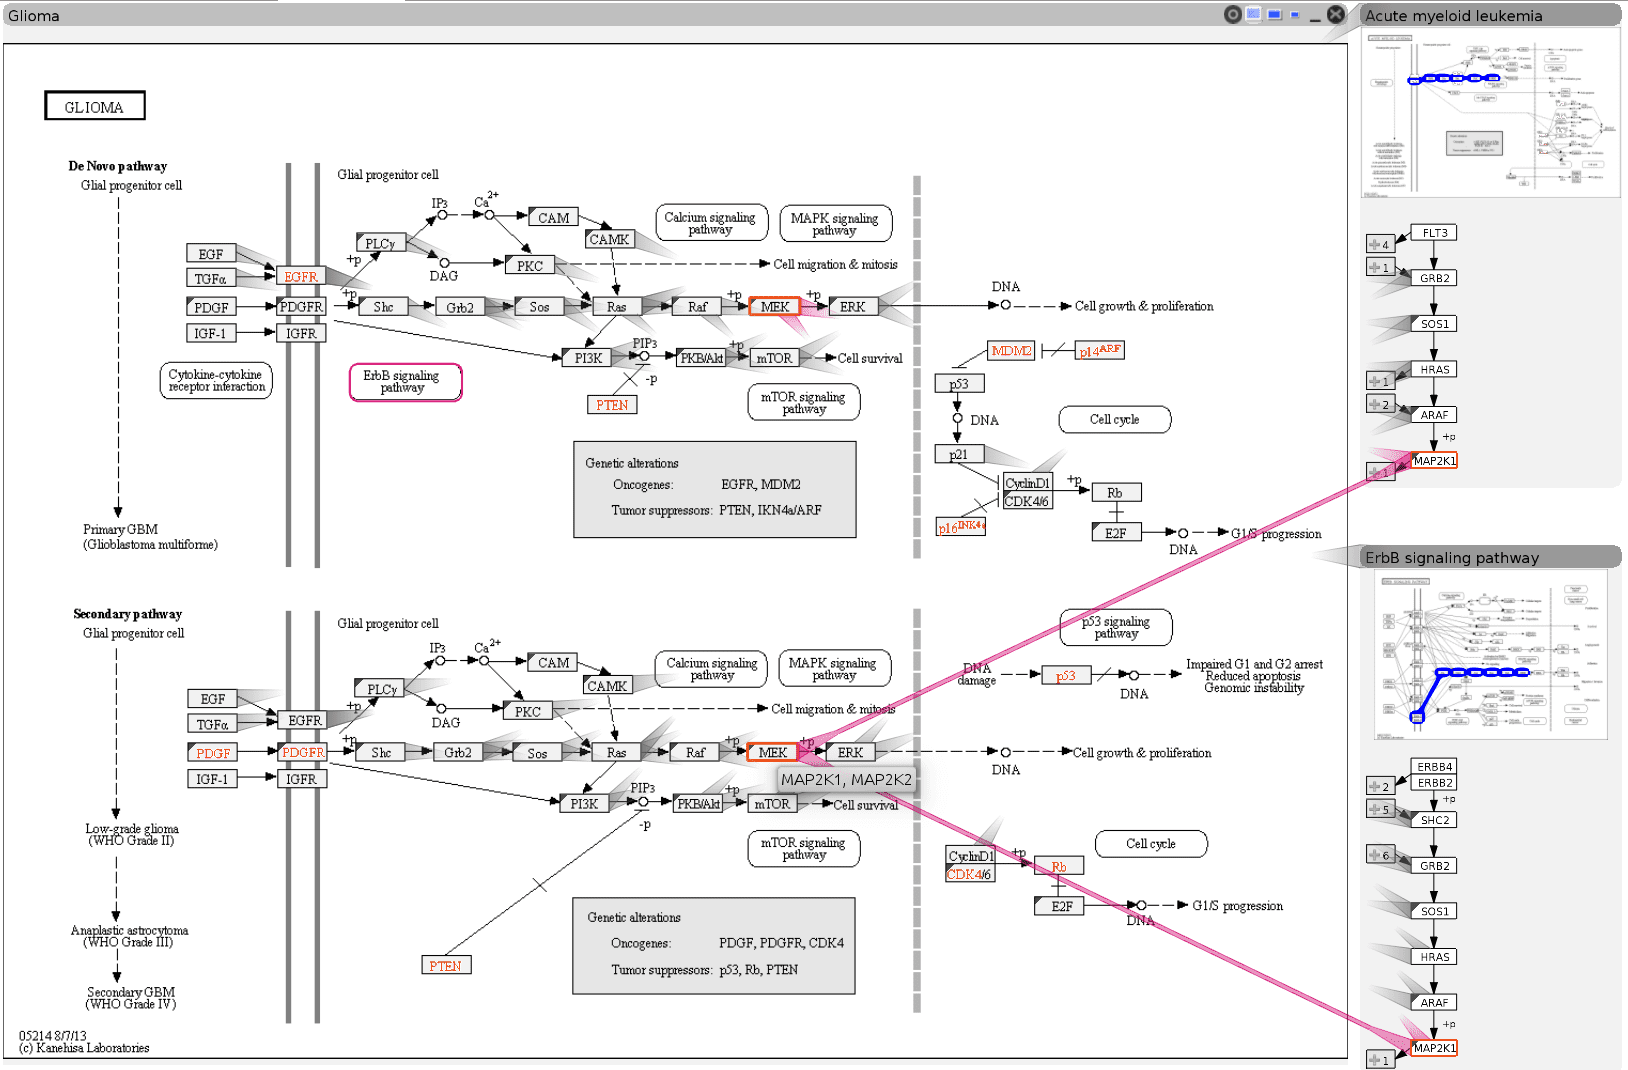
JavaScript/JS Caleydo molecular pathways metabolism omics genetic bio
Entourage visualizes biological pathways and interdependencies. It allows analysts to check for side-effects of a drug, to see if, for instance, it could have a side effect on another process.

JavaScript/JS music random culture cultural tf-idf
Create interactive song lyric visualizations; each word appears as a node, with node size according to the frequency of occurrences, and edges based on word proximity.
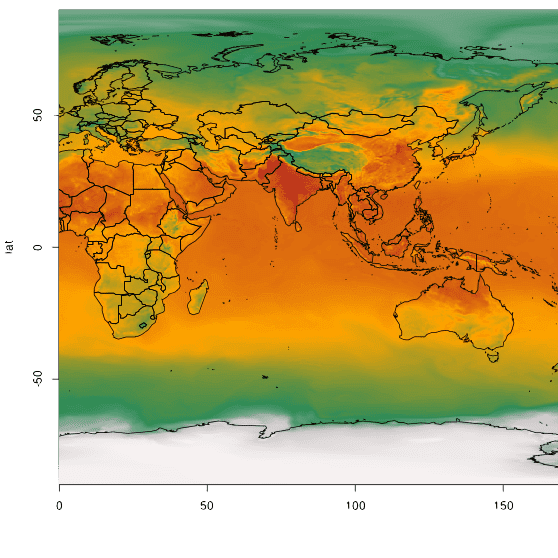
R-project
A set of tools for manipulating geographic data; includes binary access to 'GSHHG' shoreline files and interface wrappers for exchanging spatial objects with PBSmapping, spatstat, and RArcInfo packages.
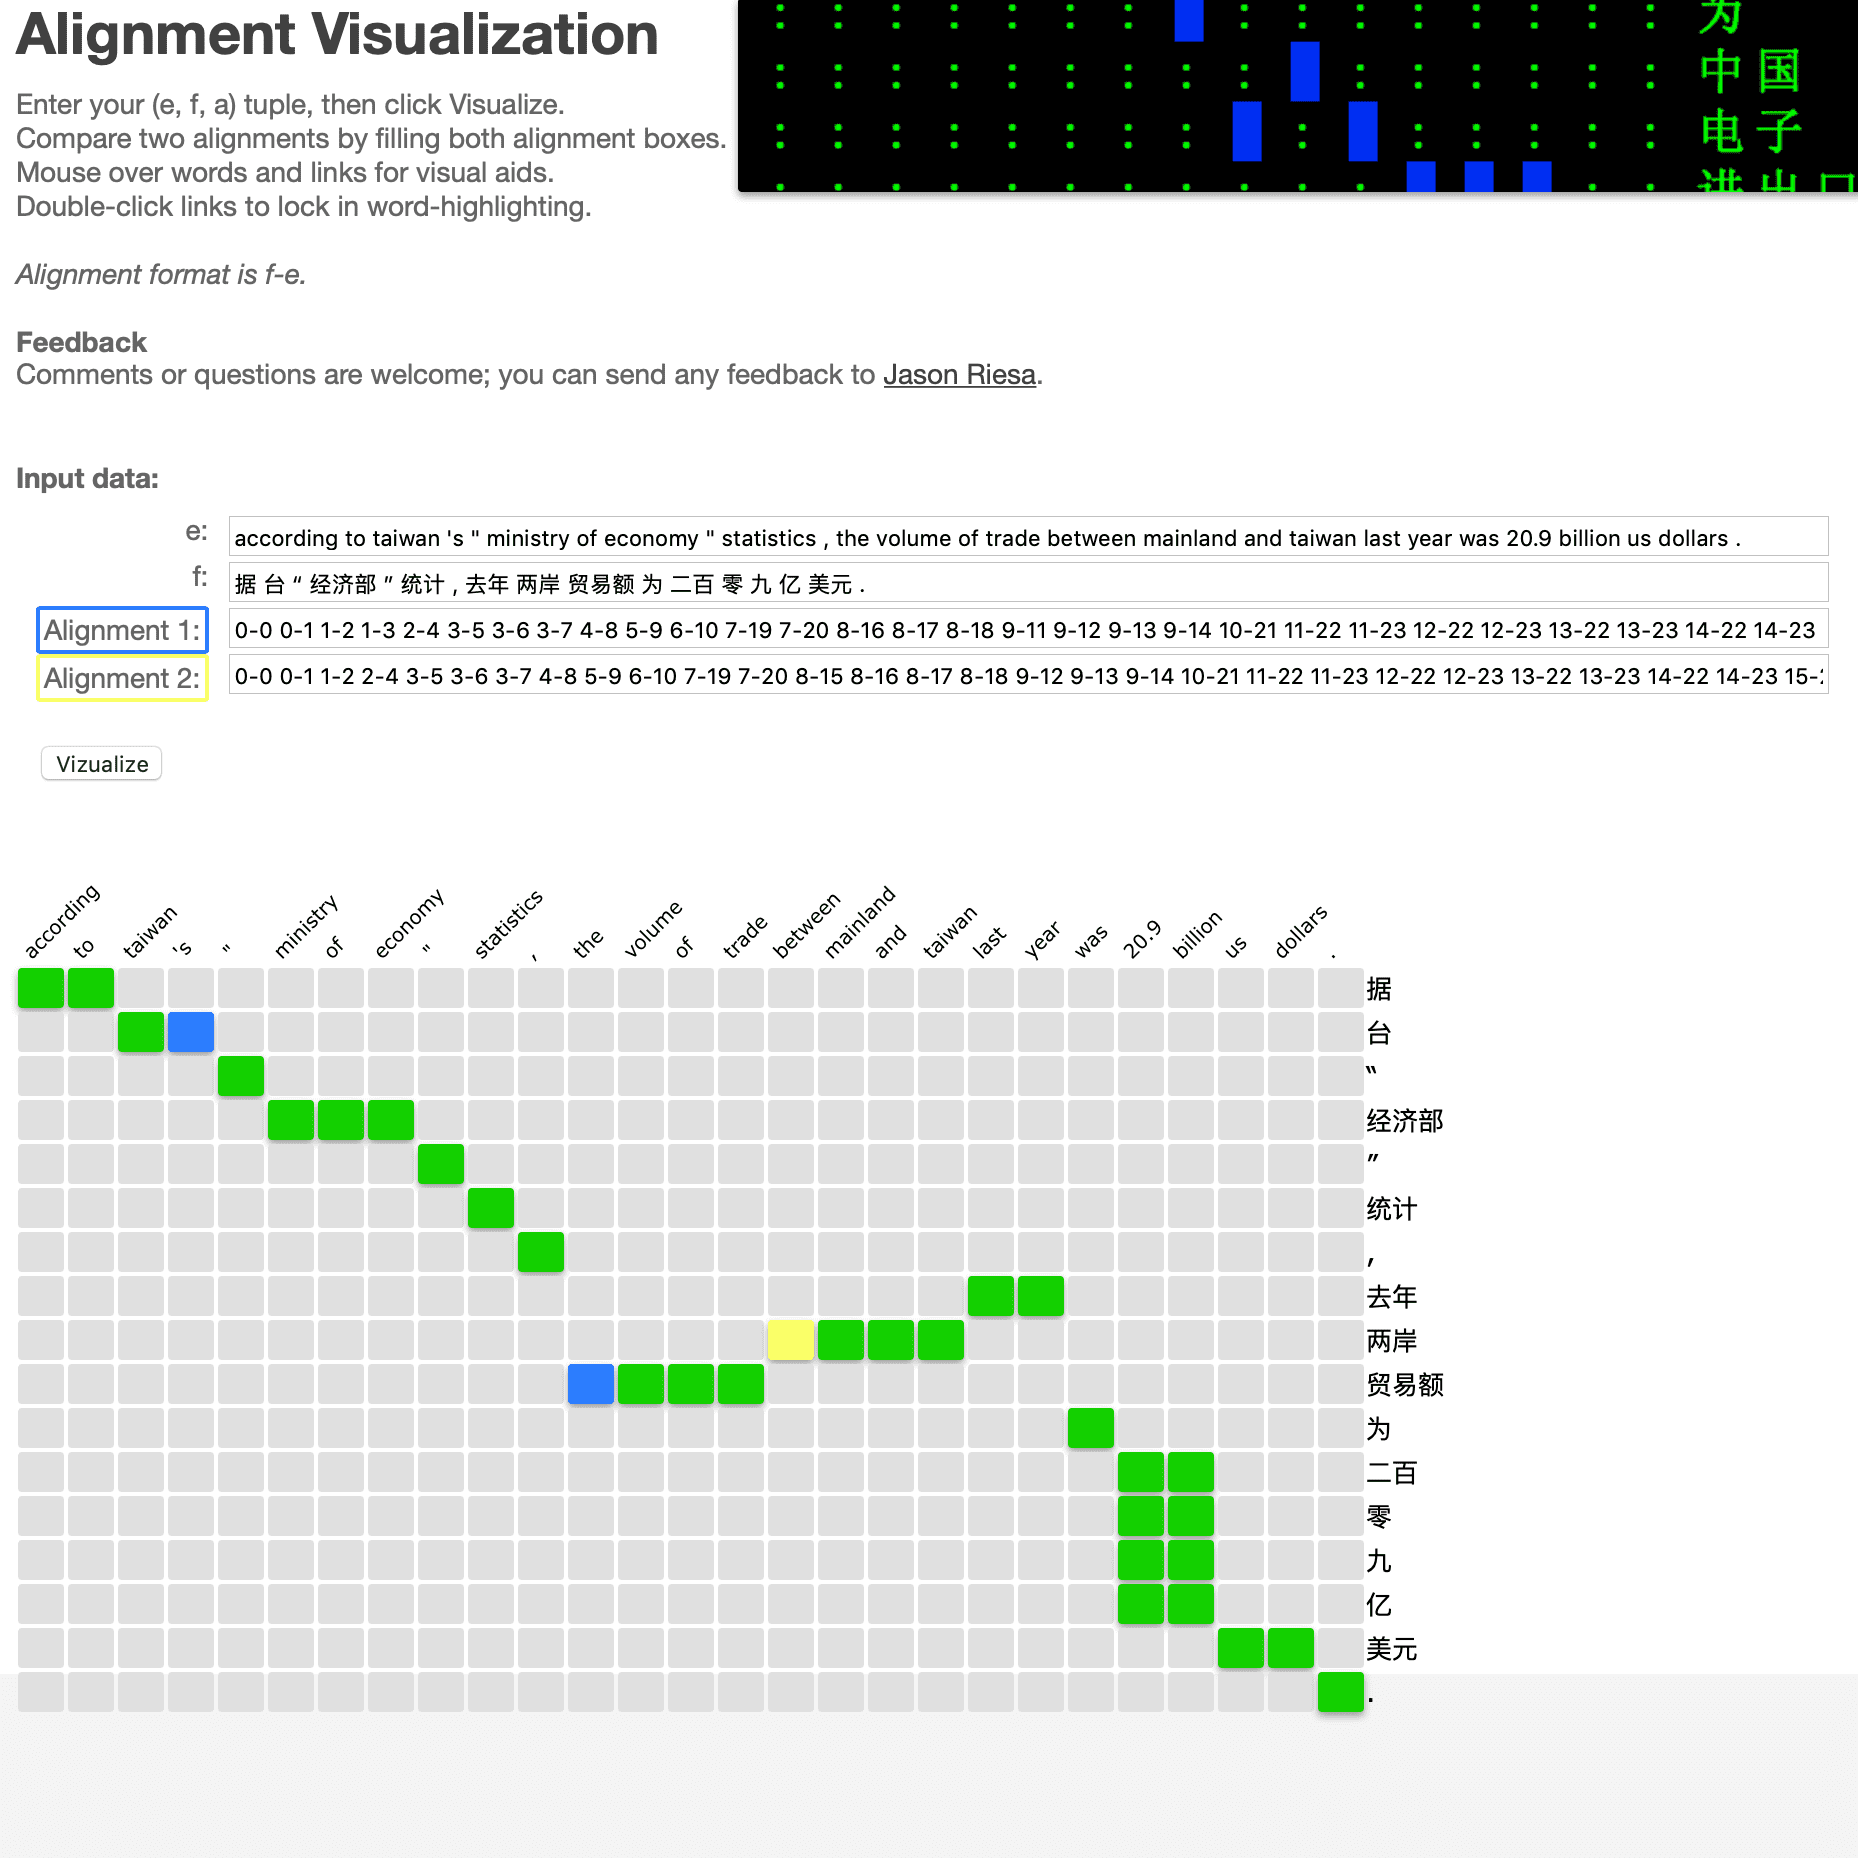
Python word alignment
A simple commandline-based word alignment visualzation tool that presents text data in a grid format; allows users to visualize two alignments at once with color-coded differences.

JavaScript/JS jQuery Twitter tweets heatmap
Twheat allows you to search for an area and generate a heat map from a Twitter search in real-time, using the WebGL Heatmap plugin while embedding tweet content in GeoJSON.

JavaScript/JS force directed financial
This is a force-directed graph visualization of the Pearson Correlation Coefficient (PCC) of the world's top traded currency pairs. This can be used to provide insight on what pairs move the same way (or opposite) and calculate the risk accordingly.

word clouds wordclouds
A tag cloud visualisation tool that shows the gradual movement between word context views (co-occurrence and proximity), and word-comparison views (association strengths).
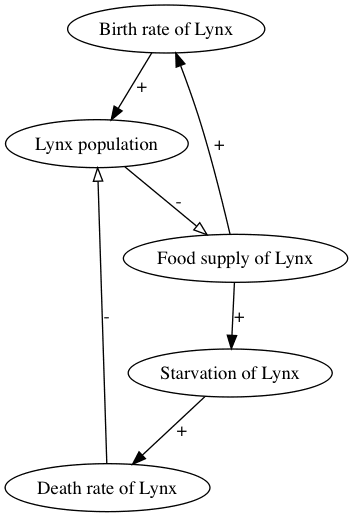
Python causal loop diagrams system dynamics explainables explorables scenario-based
CLDx, or Causal Loop Diagrams with network, allows users to model systems comprised of multiple elements interacting with each other through balancing loops and feedback loops.

Python space orbitology orrery 2D random astropy matplotlib
Azely (pronounced as "as-elie") is a Python package for computation and plotting of horizontal coordinates -- azimuth and elevation -- of astronomical objects at given location and time.

JavaScript/JS process tracing flow diagrams documentation communications security logs forensics
Generation of diagram and flowchart from text in a similar manner as markdown
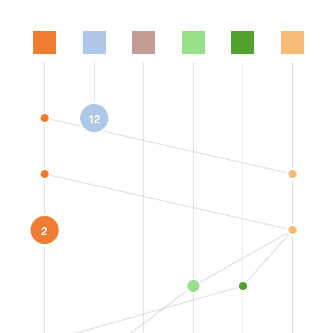
JavaScript/JS D3 process tracing flow diagrams documentation communications security logs forensics
The ShiViz visualization engine generates interactive communication graphs from distributed system execution logs with time flowing from top to bottom.

JavaScript/JS concordance barcoding natural language processing NLP rugplot literature literary culture cultural random
A Concordance plot shows you where in a set of texts a particular search word appears. Drag in your own texts and visualize the frequency of a term; punctuation is automatically removed.
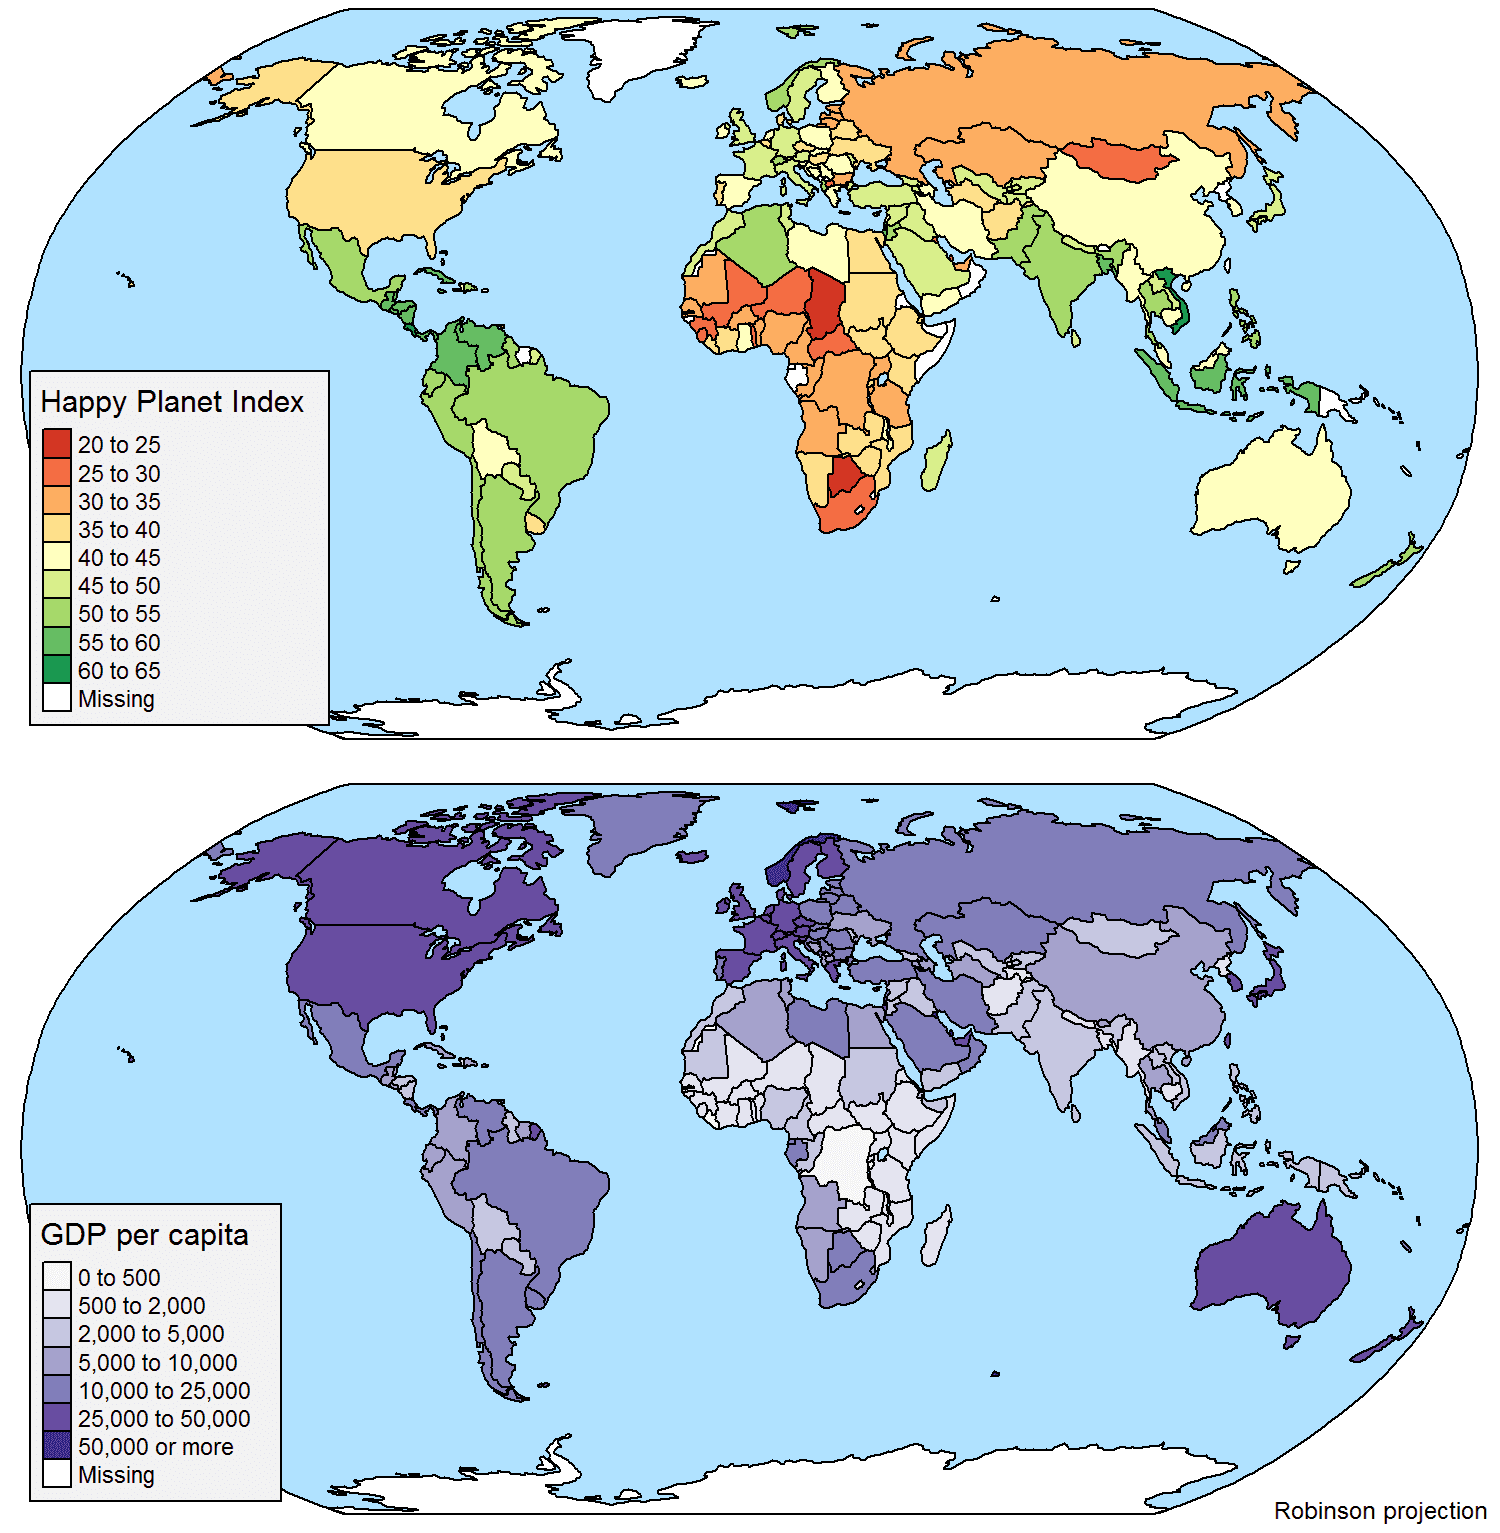
R-project ggplot2
tmap is an actively maintained open-source R-library for drawing thematic maps. The API is based on A Layered Grammar of Graphics and resembles the chart syntax of ggplot2.

Desktop content natural language processing NLP highlighting random
Originally developed for rhetorical analysis, DocuScope can annotate a corpus of text against a general dictionary of regular strings; also capable of exploring and creating new domain-specific dictionaries.
JavaScript/JS D3 Leaflet space orbitology daylight visibility orientation science time series geography orbitology lighting
Explore how daylight hours change throughout the year in locations across the globe. Tap or hover over different points to update the daylight contour plot. Time zone data is current as of IANA 2020a.
JavaScript/JS D3 networks maps CSV Excel mlviz bias big data
Discover and understand patterns in the structure of networks — identify themes in tagged documents, videos, and images — see the landscape of communities — probe for bias in machine learning data — find structural leverage points in networked systems. Formats: upload node and links data from Excel or CSV (up to 5,000 nodes).
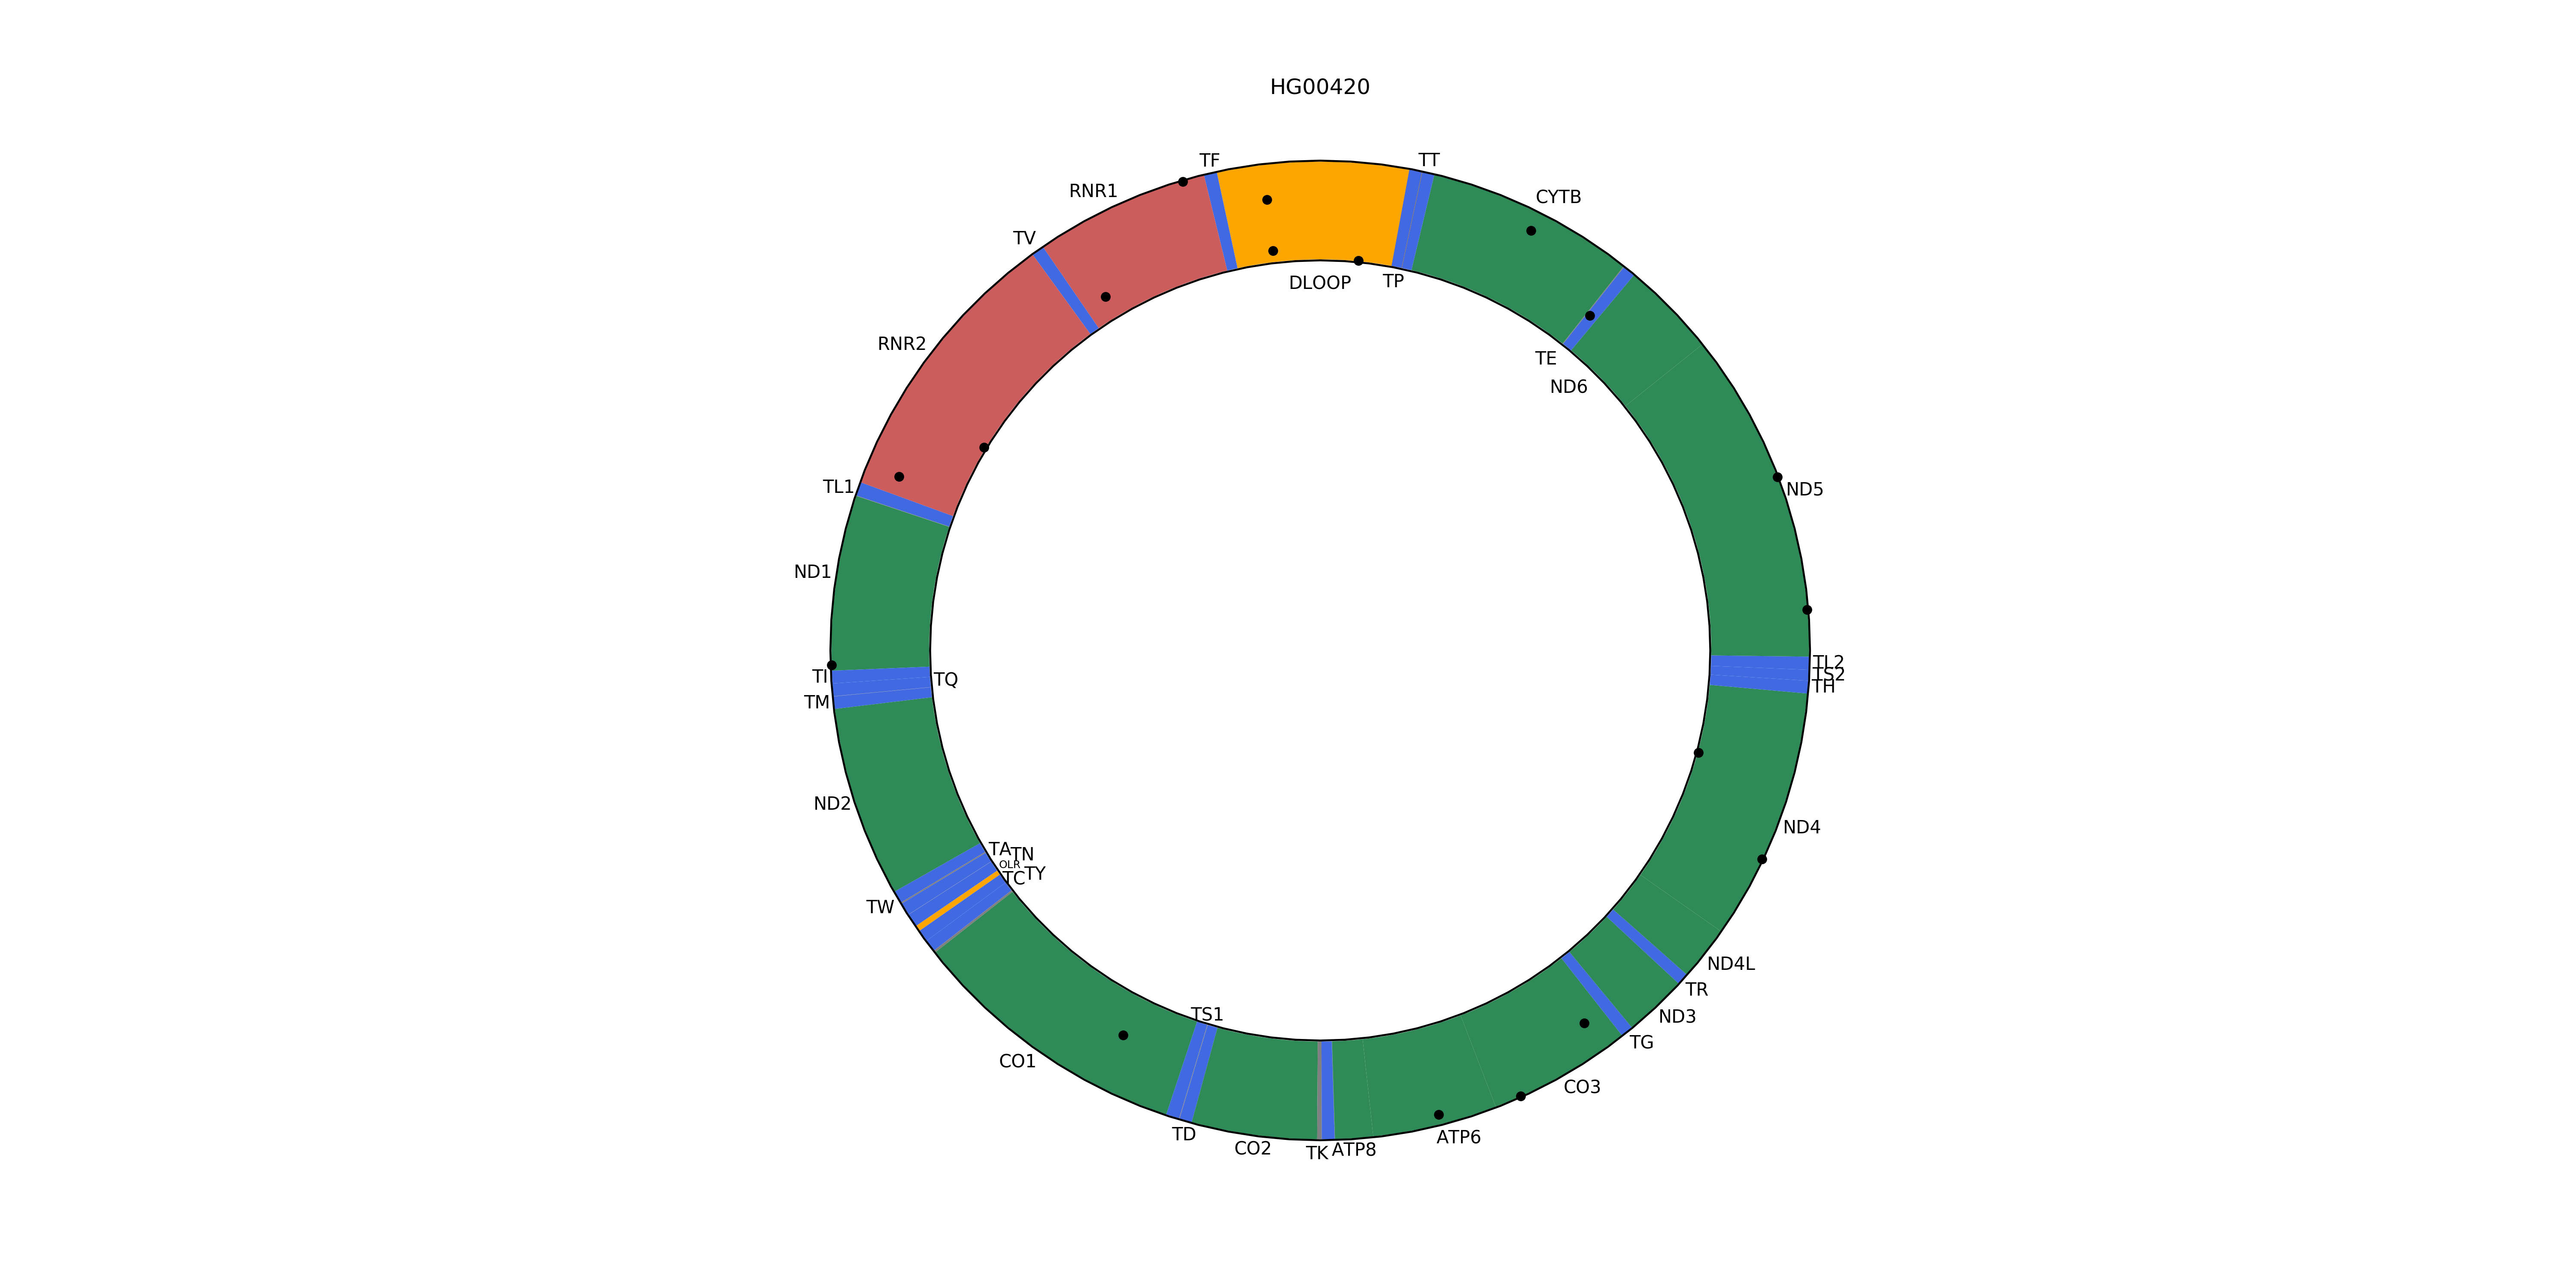
Python pandas biological mitochondrial circular gene genome genomics DNA
mitoviz is a simple python package to plot human mitochondrial variants on a graphical representation of the human mitochondrial genome. It currently supports plotting variants stored in VCF and tabular files, as well as from general pandas dataframes when importing mitoviz in Python.

Python URL security social media forensics directed graph
Unfurl takes a URL and expands ("unfurls") it into a directed graph, extracting every bit of information from the URL and exposing the obscured. It does this by breaking up a URL into components, extracting as much information as it can from each piece, and presenting it all visually.
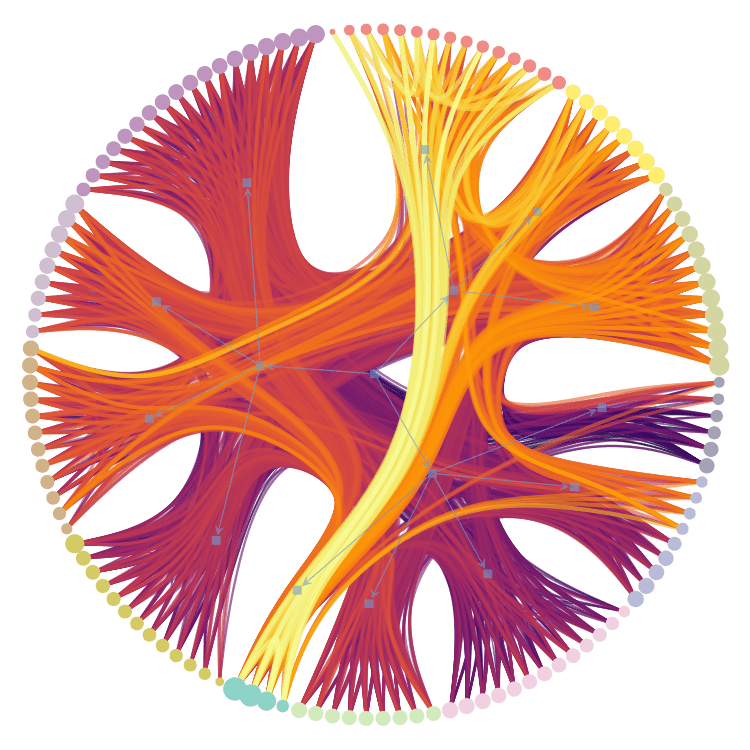
Python
Graph-tool is an efficient Python module for manipulation and statistical analysis of graphs and networks, with several general graph measurements, data structures and algorithms.
Project GitLab

Desktop OpenGL 3D 0 Zero
Organize your information and ideas in a 3D landscape! Fly around your files, data, and maps using Google Earth type controls. Any topic can link to any other; multiple parents allowed.
Zero code tool
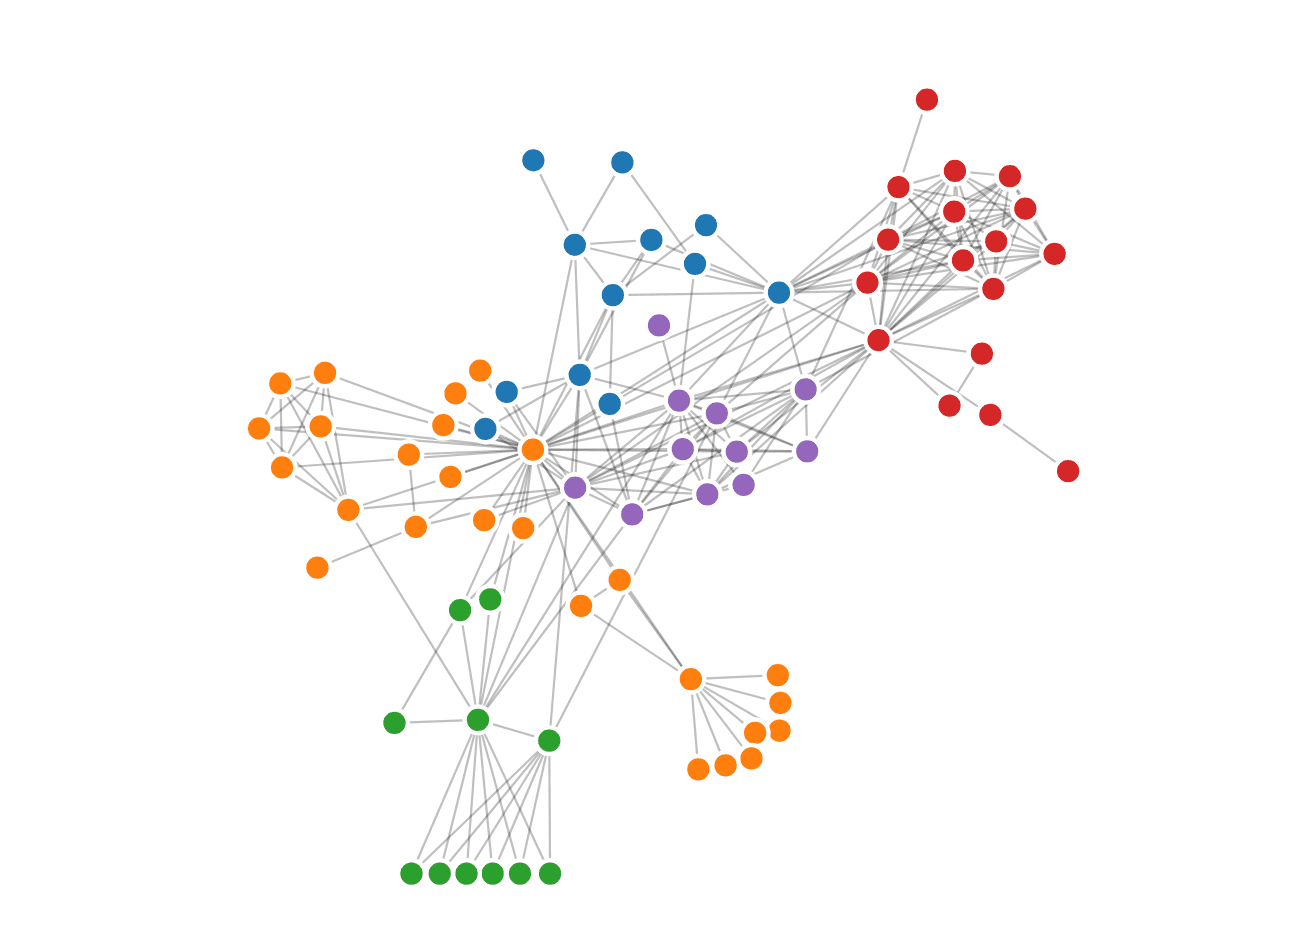
Cloud 0 Zero
ConnectTheDots shows how your data elements connect by analyzing them as a network. Analyzing the connections between the "dots " in your data is a fundamentally different approach.
Zero code tool

Python easy No License bio
eMovie is a plug-in for PyMOL that makes the creation of molecular movies both easy and intuitive via a breakthrough storyboard interface, similar in nature to what is used in the creation of traditional movies. The eMovie homepage is accessible at www.weizmann.ac.il/ISPC/eMovie.html.
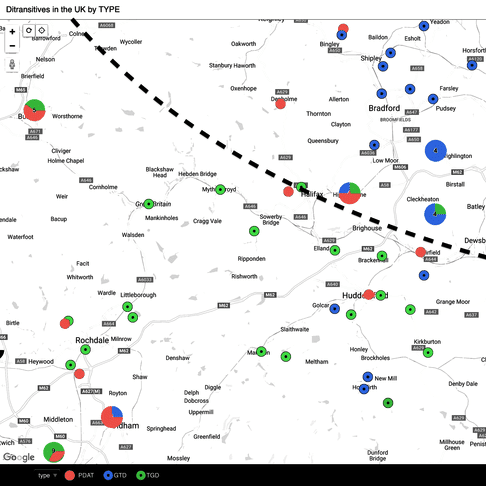
spreadsheet tabular geocoding
Create a pin map with data from spreadsheets, or from tables in web pages and database. If you are starting from scratch, BatchGeo offers a Spreadsheet Template to help format your data.
More information

globe
Biosphere3D is an open-source project that targets interactive virtual globe rendering; supports multiple scales including eye-level (First Person View) or near ground-level perspective.
More information

geocoding
A few clicks suffice to add points of interest to any geographic area of your choosing; from there, geocode multiple addresses, perform batch updates, and display directions.
More information

administrative divisions
GADM, the Database of Global Administrative Areas, provides high-resolution spatial data/shapefiles for all countries and their second-level administrative sub-divisions.
More information

geocoding
Easy-to-use geocoding, reverse geocoding, address normalization, and data matching for US and Canadian addresses; automatically corrects minor typos and inconsistencies.
More information

maps
A fast, simple tool to create, change, and publish maps; allows users to add layers, zoom to features, add bboxes, flatten multi-features, and load polylines or WKB/WKT strings.
More information

geocoding
As RSS and Atom become more prevalent as a way to publish and share geographically tagged feeds, it becomes increasingly important that location is described in an interoperable manner.
More information

spreadsheet tabular geocoding
Easily work with location data in spreadsheets by calling calling =GEO_MAP. Get comprehensive location lookup by state, neighborhood, and other attributes with simple functions.
More information

GPS tracking geodata
GPS Visualizer is an easy-to-use online utility that creates maps and profiles from geodata, such as tracks and waypoints, as well as driving routes, street addresses, or simple coordinates.
More information
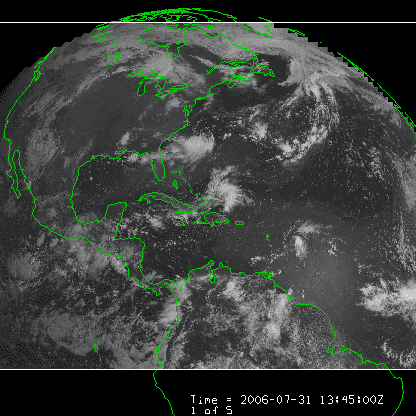
buildings and citiies
The Integrated Data Viewer (IDV) is a Java-based software framework for geodata analysis and geovisualization developed at the Unidata Program Center (UPC) with National Science Foundation funding.
More information

map design
Develop custom mapping and location applications from start to finish in your own private cloud or on-premises infrastructure. Mapbox Atlas is an offline location platform deployable anywhere.
More information

basemaps
Mapbox Studio allows you to create beautiful custom maps; start with one of seven templates fit for transit, outdoors, data visualization, or build an original map from the ground up.
More information

raster maps GeoJSON
Maphub allows you to create interactive maps by adding points, lines, polygons or labels. Select from 20 different basemaps, with custom permissions, and KML, GPX and GeoJSON input/output.
More information

Shapefile GeoJSON TopoJSON 0 Zero
Build beautiful interactive maps with ease. Add locations with photos, videos and 360 tours. Create categories and filters. Customize your layout and map style with no coding involved.
More information

custom maps Shapefile, GeoJSON, TopoJSON, CSV
Mapshaper supports Shapefile, GeoJSON, TopoJSON, CSV and several other data formats. CLI enables users to simplify shapes, edit attribute data, clip elements, erase, dissolve, filter and more.
More information

GIS management tilesets tilemaps
Maptiler offers a cloud-based custom mapping platform, a desktop-based zoomable map generator for geovisualization, and a powerful processing engine with automated geodata workflows.
More information

GIS management C#
The MapWindow GIS project includes a desktop geographic information system (GIS) with extensible plugins, ActiveX controls, and C# library called DotSpatial.
More information
weather maps meteorological meteorology radar hurricanes
McIDAS is a suite of sophisticated software packages for use with geophysical data, such as satellite and radar imagery, in-situ observational reports, and gridded numerical forecasts.
More information

0 Zero Wordpress maps timelines chronology spatiotemporal digital humanities culture cultural annotate annotations literature literary culture cultural random
Designed for ease of use, Aesop is a collection of thirteen different multimedia components wrapped in a plugin that can be used to present rich, interactive narratives or story artifacts.
Zero code tool
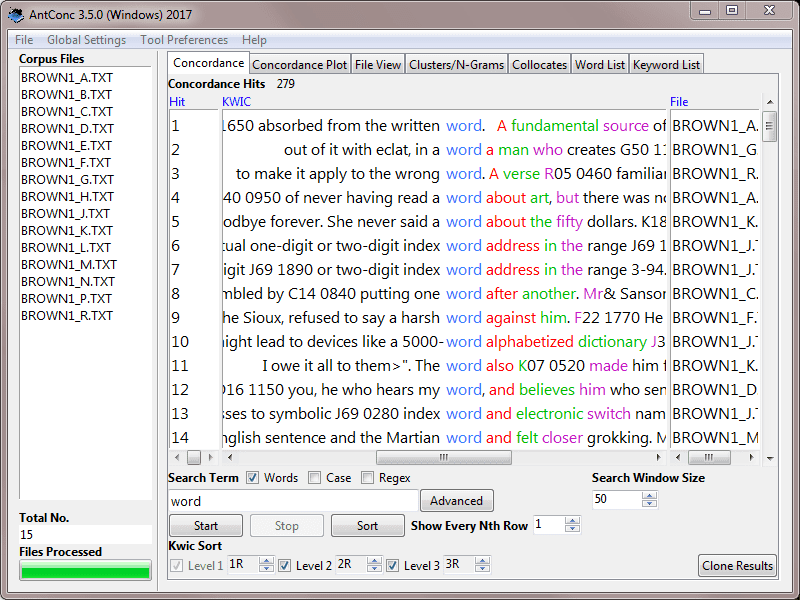
concordance highlighting barcode barcoding content natural language processing NLP
A freeware corpus analysis and concordancing toolkit that visualizes keywords in context as clusters, barcodes, highlighted lists, and in tabular format; available for both Windows and Mac OS X.
Free Download

Python content natural language processing NLP
Beautiful Soup pulls text strings and other data out of HTML and XML files; compatible with multiple parsers to provide idiomatic ways of traversing, searching, and modifying trees.
More information

Desktop content natural language processing NLP tf-idf
Visualize features in collections of text documents, including ngrams, fuzzy repetition patterns, including increasing and decreasing frequency as well as concentrated spikes.
Desktop

I2 sentiment
Used by investigative journalists, archivists, and other researchers, Muse browses large email archives and unravels topics, text sentiment, and people involved in past threads.
Free Download

Desktop Processing Java SE random culture cultural content natural language processing NLP
Poemage visualizes the sonic topology (end rhyme, internal rhyme, assonance, consonance, alliteration, other sonic devices, structural connections, and linguistic resemblances) of texts.
Free Download

Desktop Processing Java SE culture cultural content natural language processing NLP
Built in Processing to query complex rhymes, RhymeDesign decomposes the contents of poems and lyrics into several levels of sonic attributes, identifies rhyme type, and describes rhyme specification.
Free Download

JavaScript/JS and Python bio phylogenetic trees
SplitsTree4 is a leading application for computing and visualizing unrooted phylogenetic networks from molecular sequence data using a wide variety of reticulation and decomposition methods.
More information

word clouds wordclouds
Visualize word frequency by entering the URL of a target web page or uploading a plain text file to visualize (max. 5 MB). Alternatively, paste (or type) a max. of 500 KB of text into TagCrowd.
More information

JavaScript/JS D3 word clouds wordclouds
TagSpheres arranges tags on various hierarchy levels, placing related information tags close to each other and applying colors to make the importance of individual tags more legible.
More information
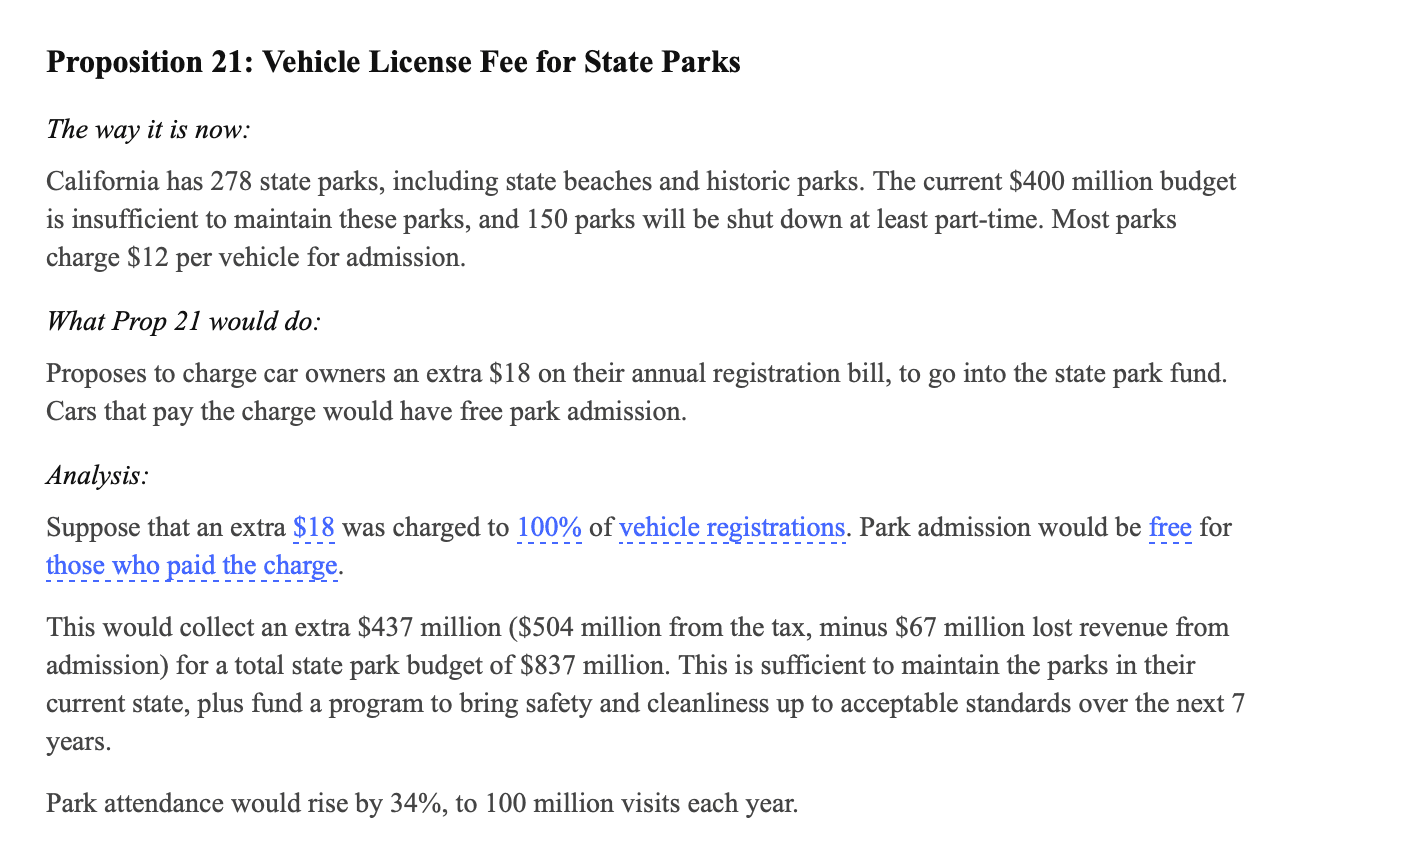
JavaScript/JS system dynamics explainables explorables scenario-based
Tangle is a JavaScript library for creating reactive documents. Your readers can interactively explore possibilities, play with parameters, and see the document update immediately.
More information

Java SE content natural language processing NLP hapax
Text Variation Explorer (TVE) is an interactive Java text visualization tool for exploring type-token ratio, proportion of hapax legomena, and average word length under different scenarios.
More information

Xcode/iOS content natural language processing NLP
Textal allows you to take the content of websites, tweet streams, and documents and explore the relationships between words in the text via an intuitive word cloud interface.
More information
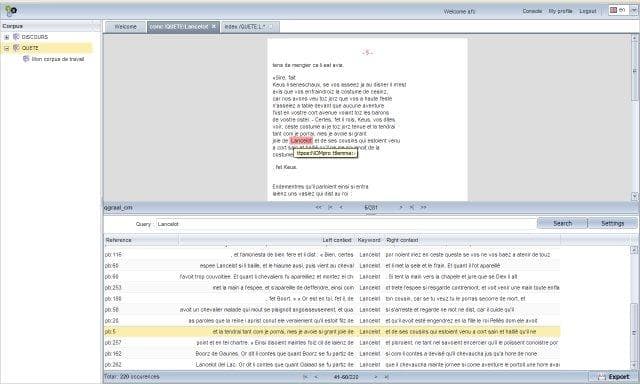
Desktop concordance content natural language processing NLP
Validated for use in the humanities, Textometry analyzes large bodies of texts and generates concordance visualizations as well as progression and specificity graphics.
Free Download
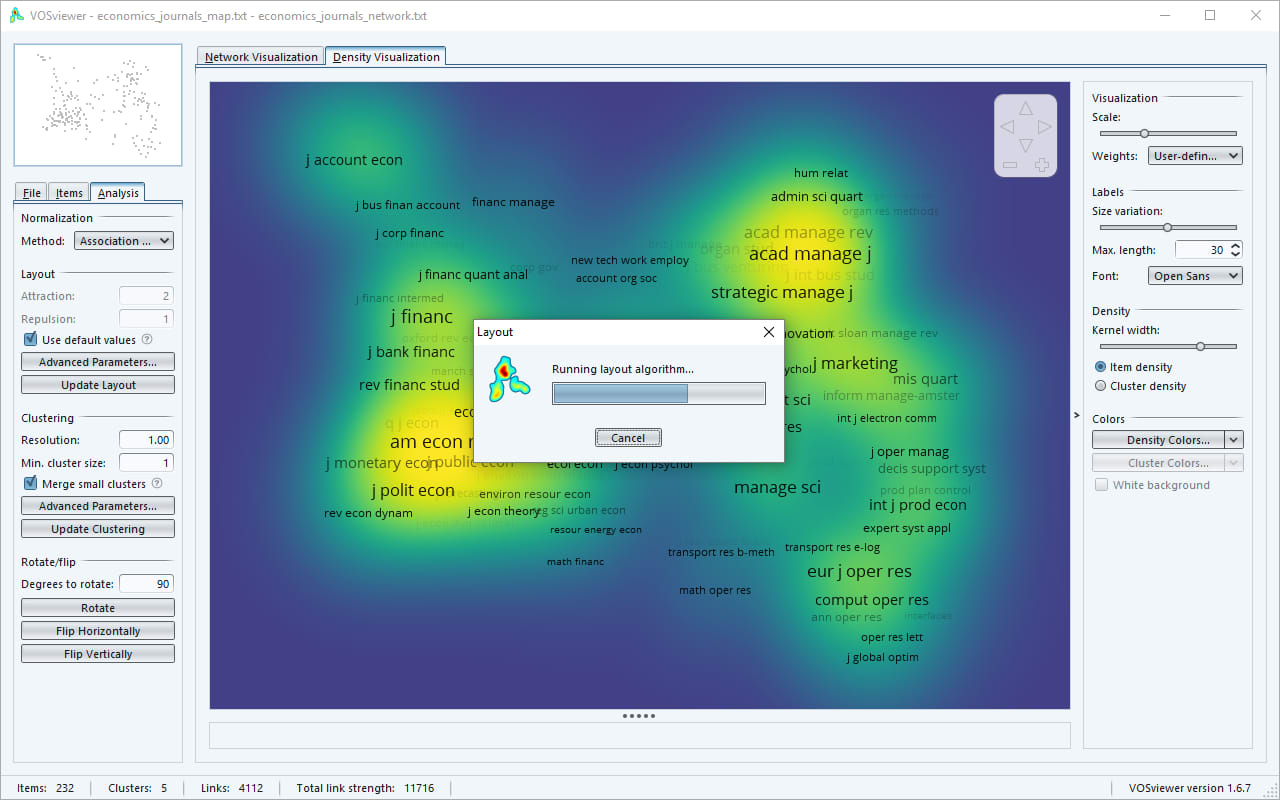
scientometrics bibliometric culture cultural content natural language processing NLP
VOSviewer cross-references, heatmaps, and visualizes bibliometric and scientometric networks across different journal and sources based on citation, co-citation or co-authorship.
Free Download

0 Zero content natural language processing NLP
Building on the traditional keywords-in-context method of text analysis, Word Tree visualizations explore repetitive context and thematic imbalance within different bodies of text.
Zero code tool

Java Desktop content natural language processing NLP graph
WORDij is a family of various programs designed to automate content analysis a substantial amount; includes Quadratic Assignment Procedures (QAP) for generating graph visualizations.
More information
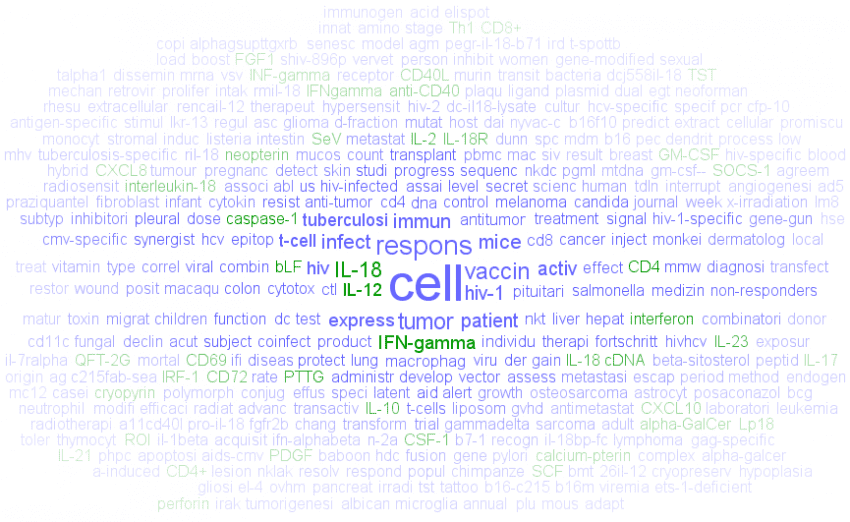
highlighting content natural language processing NLP tf-idf
KNIME Text Processing enables analysts to read, process, mine and visualize textual data through tag clouds that highlight the most frequent terms in a corpus using distinct colors.
More information

R-project natural language processing NLP sentence diagramming treebanks
TM provides a framework for mining across heterogeneous text formats and generating text visualizations in R with integrated back-end support; can handle plain text, PDFs, XML files, and other formats.
More information

0 Zero Freemium content natural language processing NLP
Textexture visualizes text in the form of network graphs. Users get a quick visual summary of the text and can then read the most relevant excerpts by clicking on individual nodes.
Zero code tool
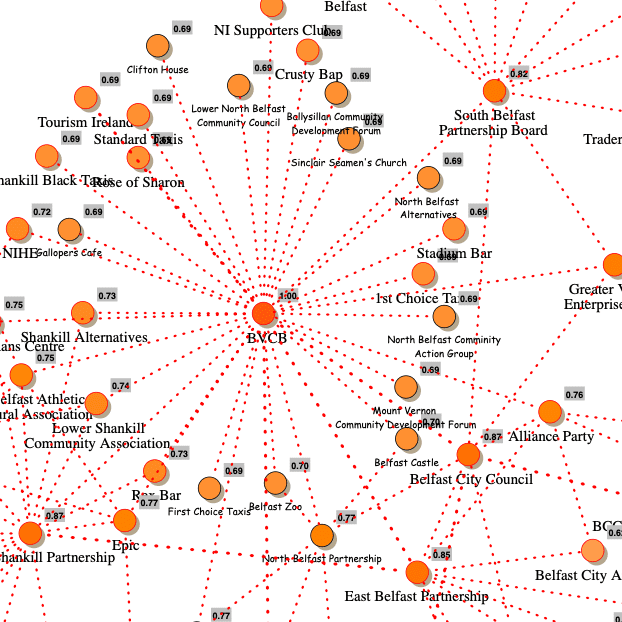
Desktop Cloud Free 0 Zero social network analysis
yEd generates high-quality diagrams including flowcharts, family trees, social networks, and Business Process Model & Notation (BPMN) diagrams. Available both in desktop version and on the cloud at yEd Live.
Zero code tool

Cloud 0 Zero argument logic
Cohere is a visual tool to create, connect, and share ideas. Back them up with websites. Support or challenge them. Embed them. Discover who - literally - connects with your thinking.
Zero code tool
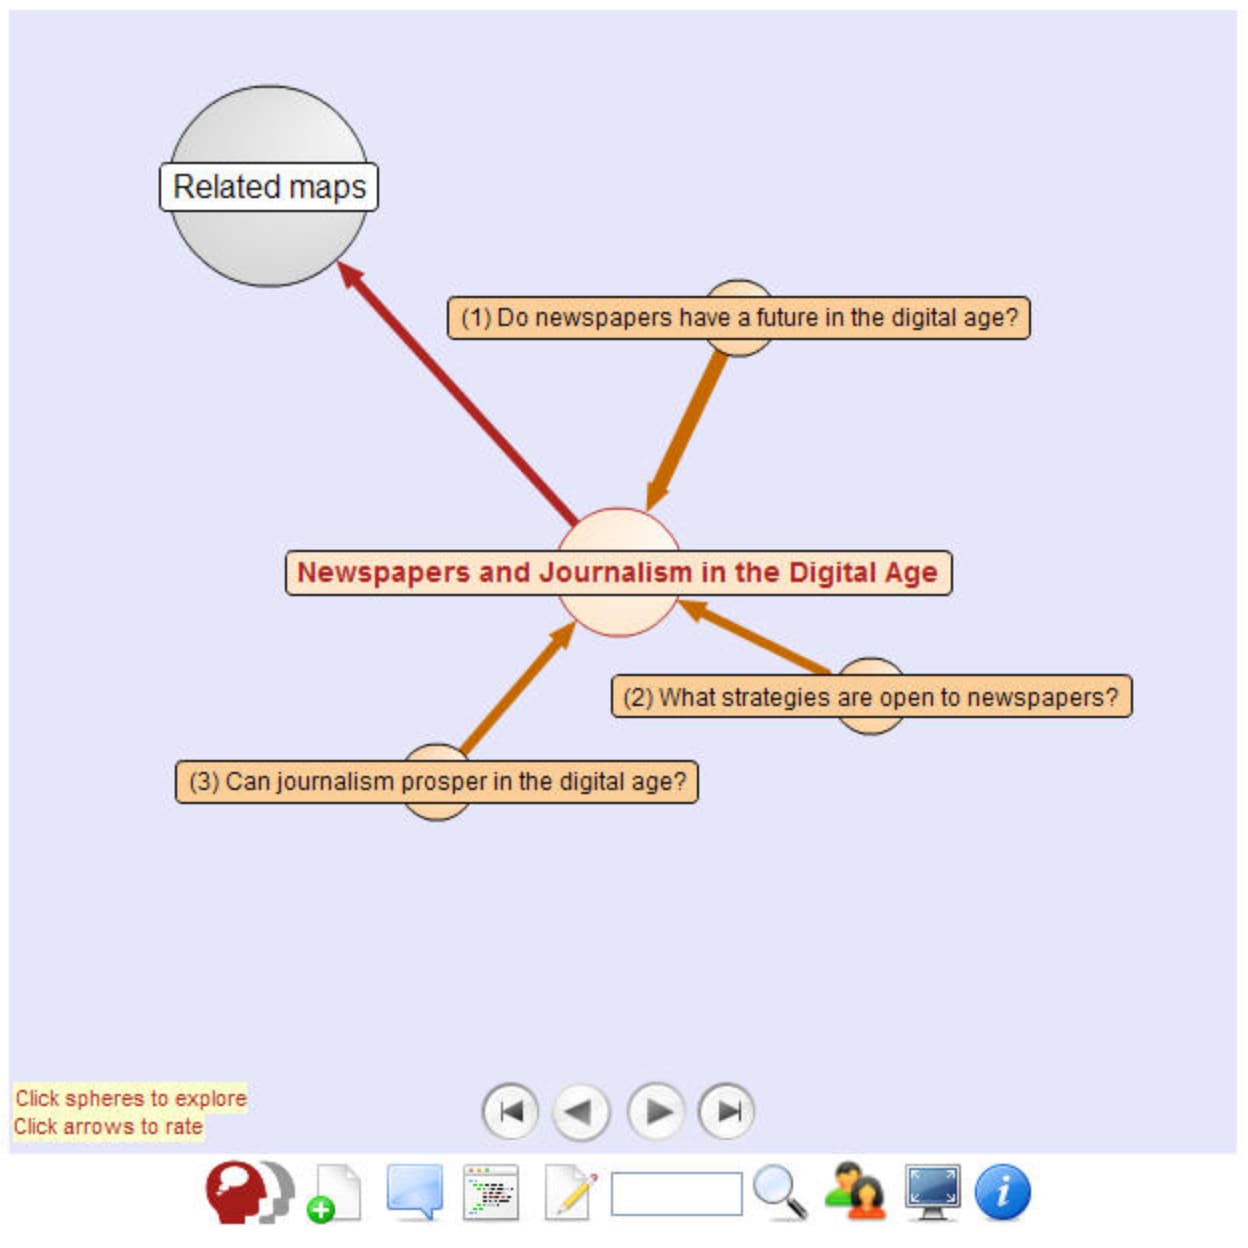
Cloud 0 Zero argument logic
Used by the White House, 10 Downing Street, the UK Foreign and Commonwealth Office, and CNN, DebateGraph is an award-winning, cloud-based deliberation and debate platform.
Zero code tool
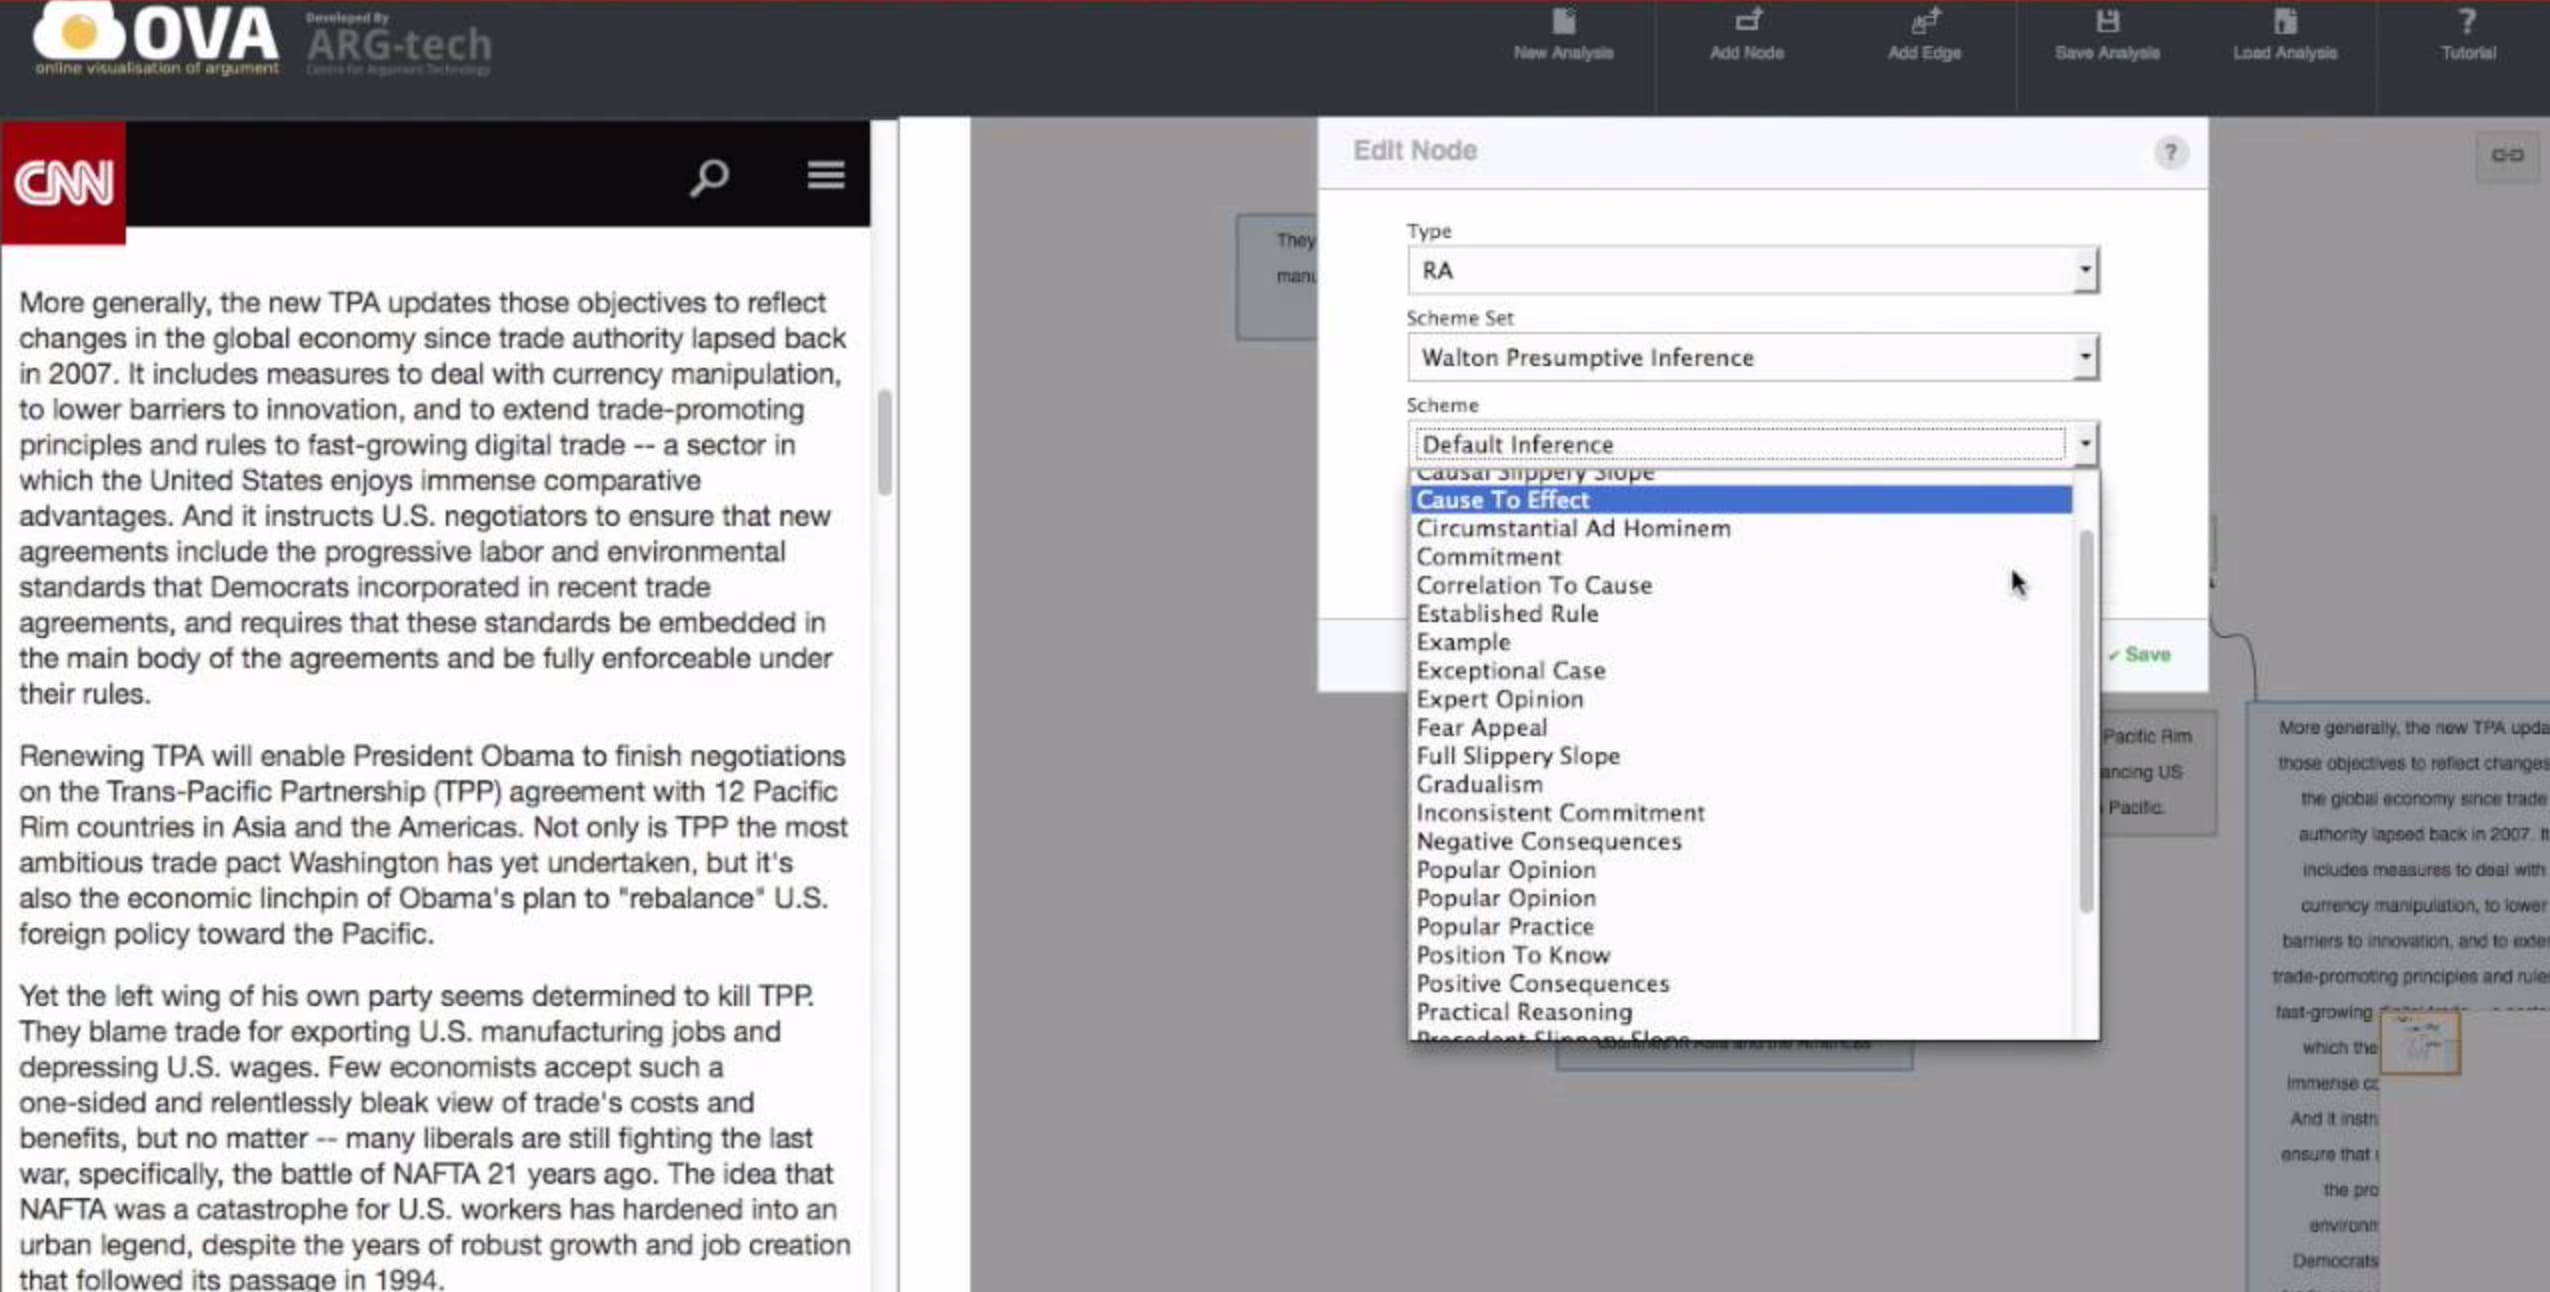
Cloud 0 Zero argument logic
The Online Visualisation of Argument tool is an online system for analysing and annotating the structure of argument and reasoning in discourse. It handles texts of any type or length.
Zero code tool

Python causal loop diagrams system dynamics explainables explorables scenario-based
The Business Prototyping Toolkit for Python (BPTK_Py) allows users to build scenarios and run complex simulations of nonlinear behaviour, with System Dynamics and agent-based modeling (ABM).
More information

Desktop Free Closed Source
Gruff is an interactive triple-store browser, query manager, and editor built on AllegroGraph. Data can be browsed visually and in tabular form, with SPARQL queries or Prolog code.
More information

Desktop Free Closed Source
Pajek is an extensively documented program for analyzing and visualizing large networks with thousands or even millions of vertices. In the Slovenian language, the word pajek means spider.
More information
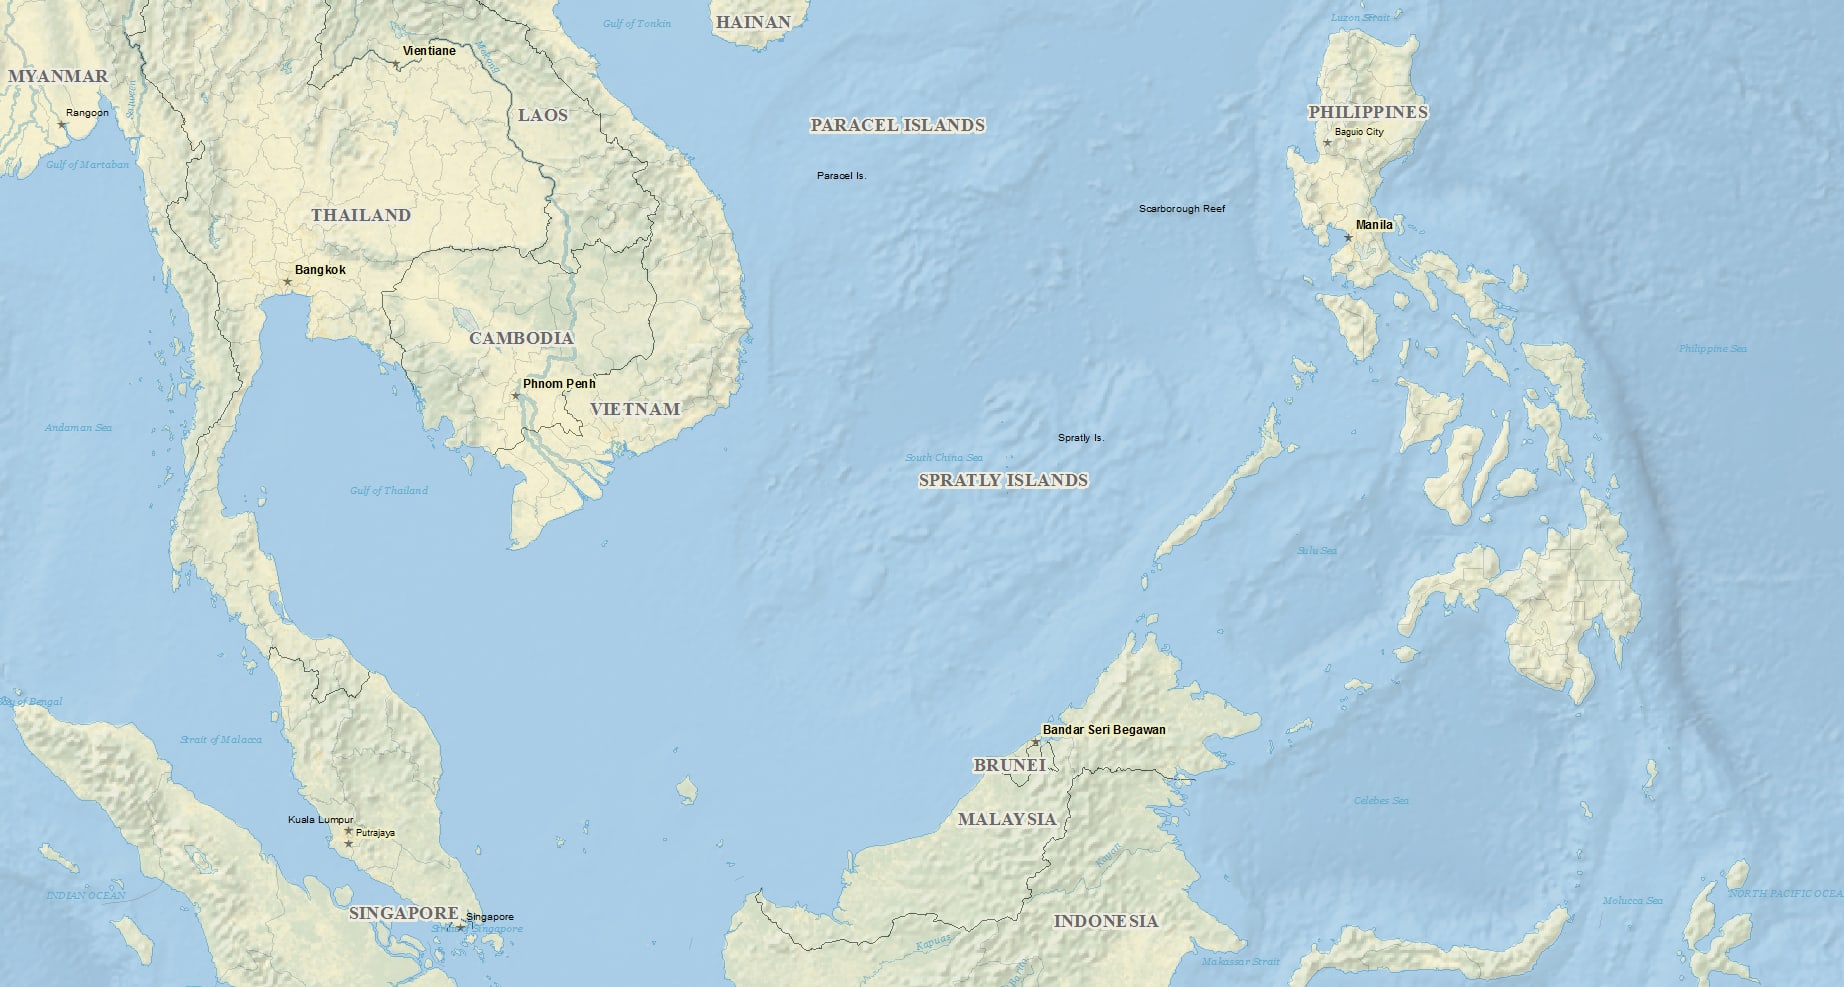
custom maps raster vector
Natural Earth is a public domain map dataset available at 1:10m, 1:50m, and 1:110 million scales. Featuring tightly integrated vector and raster data, this tool makes visually pleasing, well-crafted maps.
More information

transformation utility
Quickly and easily convert different types of shapefiles into GeoJSON format with this web app; you can also perform Ogre transformations directly by making a HTTP POST request.
More information

custom maps
Turn your spreadsheet into a map. A simple zero-code tool that lets users upload a spreadsheet containing geodata and generate an interactive online heatmap in a matter of seconds.
More information
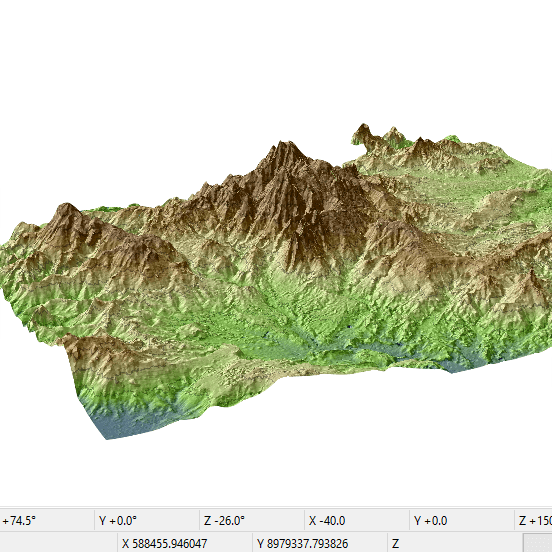
custom maps C++
SAGA, or System for Automated Geoscientific Analyses, was designed as an easy-to-use implementation of spatial algorithms, with a simple API, extensive module libraries, and linked-view GUI.
More information

JavaScript/JS
Timemap.js is a Javascript library to help use online maps, including Google, OpenLayers, and Bing, with a SIMILE timeline; allows you to work with JSON, KML, or GeoRSS data.
More information
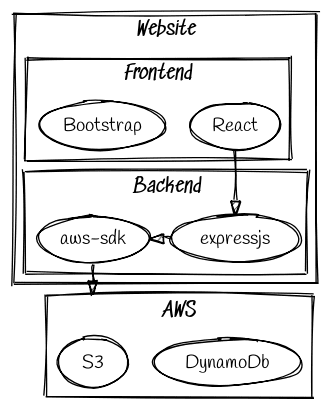
JavaScript/JS sketch DOT language Graphviz RoughJS
Sketchviz translates descriptions of graphs written in the DOT language sketchy/hand-drawn styled images.
More information